
The Perioperative Pathway: Treating the Cause, Not the Symptom
Note on the demo: All metrics come from a synthetic perioperative dataset with 2,400 surgical cases. The case demonstrates analysis paths and methods.
Many operating room initiatives pursue the same goals: more predictable scheduling, better utilization of operating rooms (OR utilization) and fewer delays or cancellations (same-day case cancellations). Metrics such as punctuality (on-time starts), turnover times or OR holds initially look like obvious control variables. Where the deviation becomes visible, the cause seems to lie there as well.
Yet in the perioperative process in particular, delays often originate somewhere else entirely. Incomplete preparation on the ward, a missing bed after the recovery room (PACU, post-anesthesia care unit) or a backlog at shared resources can propagate across several patients all the way into the operating room.
The key question is therefore not only where time is lost, but why it is lost – and which cause can actually be influenced.
The problem becomes visible in the OR. The cause often lies elsewhere. Optimizing only the OR treats the symptom. Understanding the cause leads to the right measure.
What is the perioperative patient pathway?
The perioperative patient pathway (perioperative care pathway) describes the end-to-end process around a surgical procedure: from preparation on the ward through the operating room to postoperative care. It typically includes preoperative preparation and clearance, patient call-up and transport, anesthesia induction and surgery, emergence and room exit (wheels out), care in the recovery room (PACU) and the subsequent transfer to a ward or the intensive care unit (ICU).
On a process slide, this flow also looks linear at first. In reality, however, several patients, teams and shared resources interlock at the same time. An operating room waits for a patient, a patient waits for complete preparation, a PACU bay waits for a previous patient to be transferred, and that patient in turn waits for a free bed on the ward. A delay at one point can therefore propagate across several process steps – and even across several patients.
In the operational data, this does not produce a simple patient pathway but a network of events, resources and business dependencies. These relationships are exactly what matters if we want to understand why a procedure starts late, an operating room stays blocked or a later procedure is finally cancelled due to lack of time.
Causal Process Mining preserves this granularity and the relationships between patient, surgical case, operating room, recovery room, bed and ward. Only for a specific business question is a suitable Causal Perspective derived from it.
For this use case we deliberately focus on two mechanisms: preoperative preparation that has to be completed late and backlog effects between recovery room, bed and operating room. Other conspicuous relationships – such as longer induction times of one anesthesia team, turnover times in a particular room or PACU staffing – are also considered, but first tested for whether they are actually a cause or merely a conspicuous correlation.
Looking only at the individual surgical case often shows only the symptom. The cause may have arisen hours earlier, in a different area or even with a different patient.
From the end-to-end process to the Event Knowledge Graph
The perioperative flow is not contained in a single table. In the demo setup, 26 tables from 5 different systems are brought together. Information on patient, surgical case, operating room, ward, recovery room, bed, transport and teams is therefore not available as a linear event log.
This is exactly why noreja uses an Event Knowledge Graph. It connects not only events in their temporal order but also the objects and relationships through which process effects can be transferred between different cases.
For example, a patient can be medically ready for transfer (PACU discharge criteria met) and still occupy a PACU bay because their ward bed is not yet available or not yet reported. As a result, another patient cannot leave the operating room. The visible hold belongs to case B, but part of the triggering mechanism lies in case A.
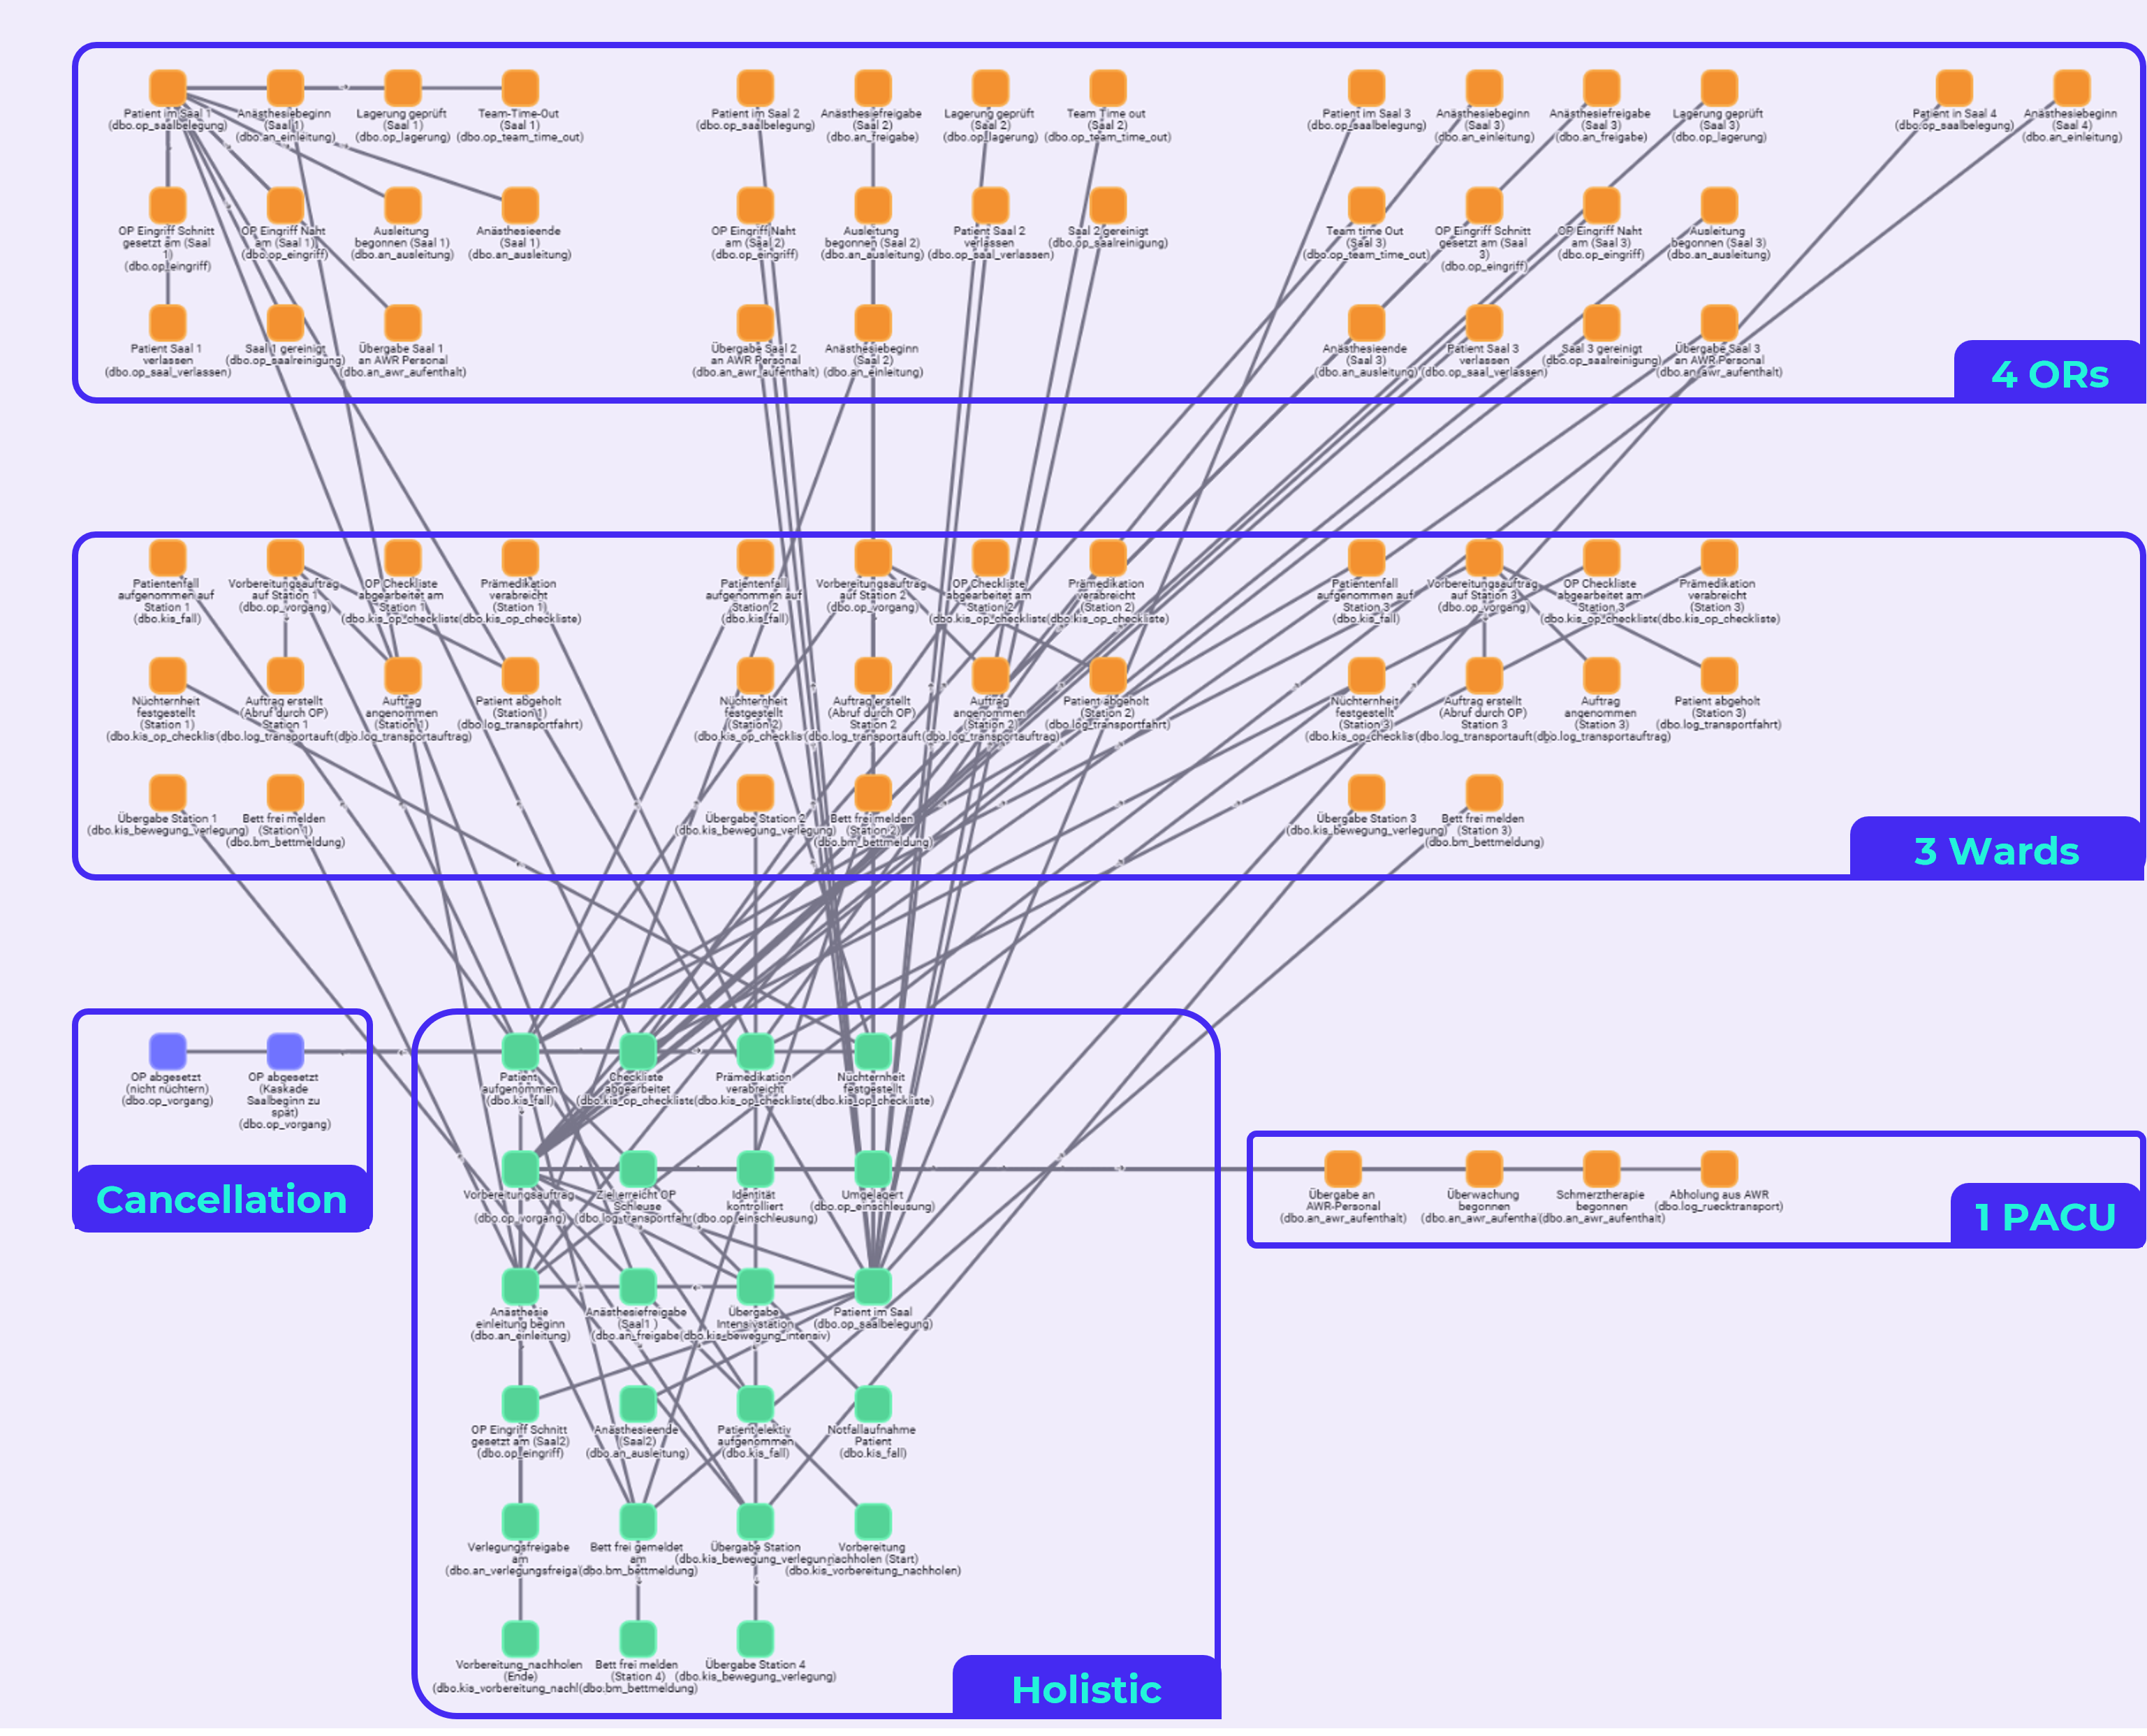
Event Knowledge Graph – Patient ↔ Surgical case ↔ OR ↔ PACU ↔ Bed ↔ Ward
One data foundation – different perspectives
The perioperative process cannot be meaningfully analyzed from a single viewpoint. Depending on the question, we therefore choose a different Causal Perspective on the same data foundation.
For the healthcare case we use five perspectives:
- End-to-end view – from the stay on the ward through the OR to postoperative care
- Preparation – for preoperative measures, patient call-up and late first-case starts
- OR view – for induction, procedure, room occupancy and turnover
- PACU / bed notification – for transfer clearance, bed release, transport and backlog
- OR day view – for several consecutive procedures and cross-case delay cascades
Which perspective makes sense depends on the business question. Three things can be chosen flexibly:
- Process scope: Are we looking at the entire end-to-end process or only a relevant sub-process?
- Granularity: Do we need individual activities, events and resources or a more aggregated view?
- Case ID / case reference: Is the relevant unit of analysis a patient, a procedure or, for example, a complete OR day?
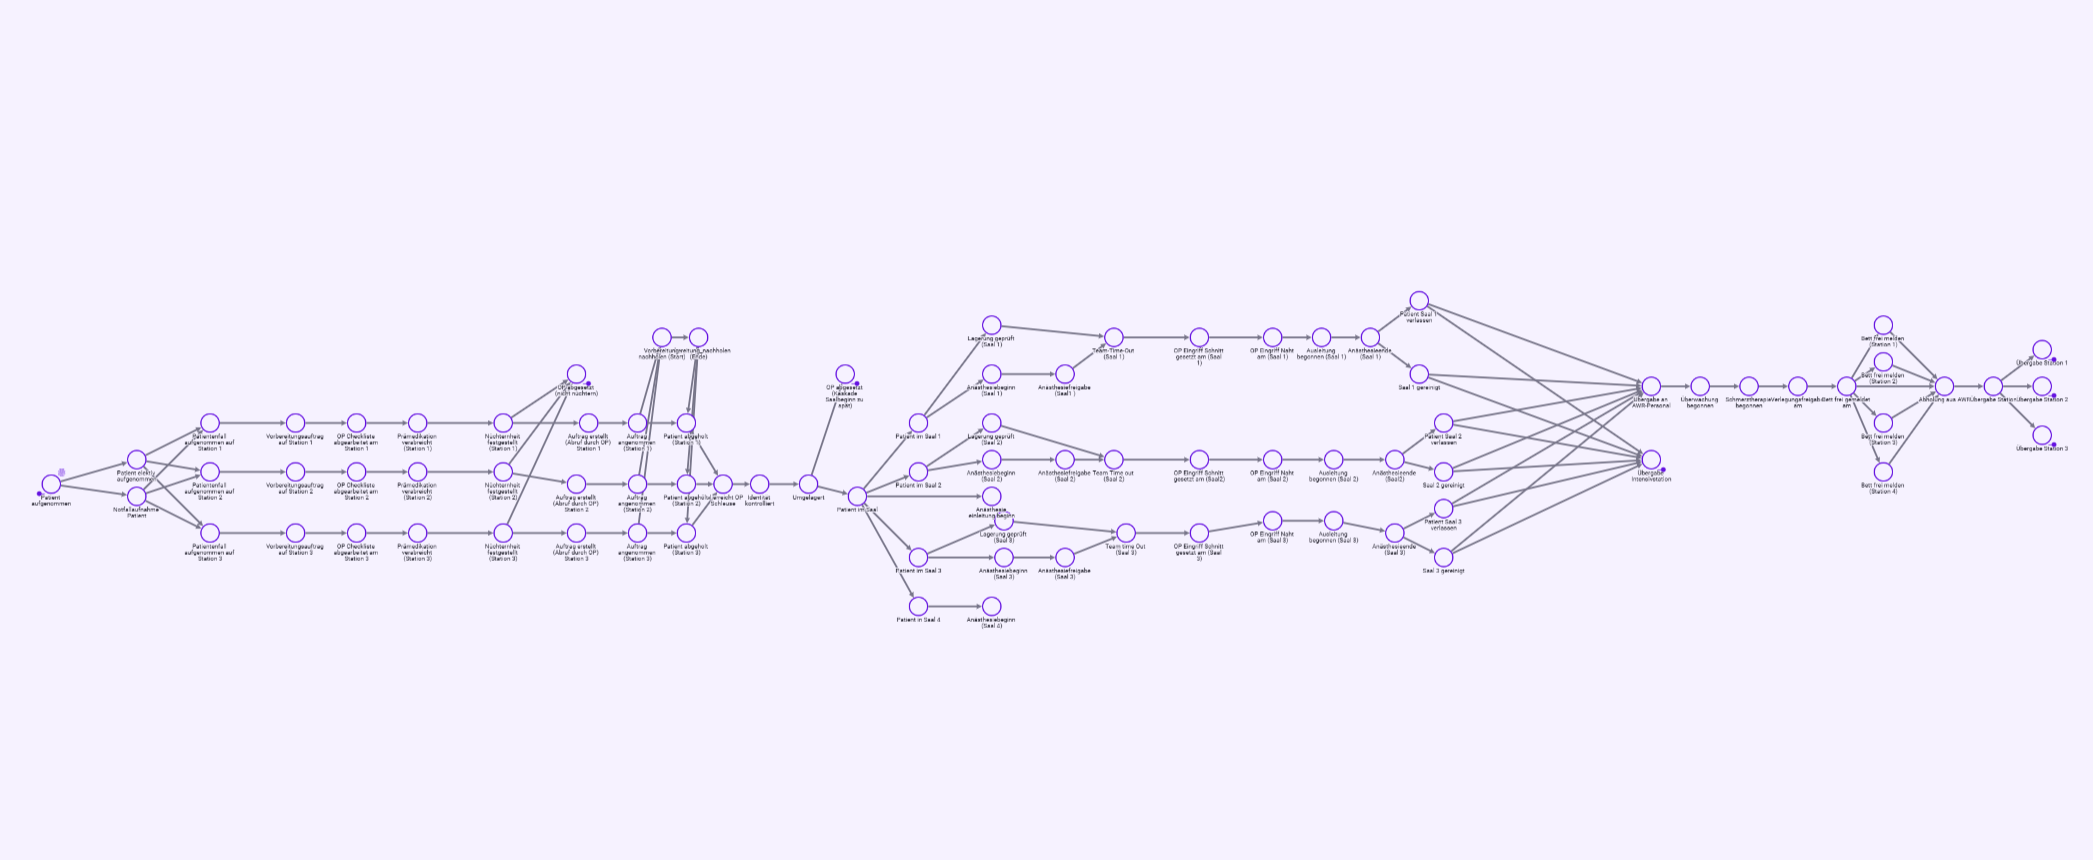
End-to-end causal perspective
Complexity is reduced during analysis, not already during data import.
The process in three phases
The same perioperative patient pathway can be cut differently depending on the question. The following three sections show the most important business blocks – from preparation on the ward through the procedure to postoperative care.
1 · Preoperative preparation and patient call-up
In the first block, the patient is prepared for the procedure on the ward. This includes informed consent, lab tests, premedication and checklists (preoperative checklist), among other things. Only when the necessary prerequisites are met can the patient be called up for surgery and transported.
This is exactly where delays can arise that only become visible later in the OR. If individual preparation steps are missing, they have to be completed at short notice. The patient reaches the room later, the first procedure is postponed – and the delay can carry over to subsequent cases.
Business objects: patient, surgical case, ward, preoperative preparation, checklist, informed consent, lab, premedication, patient transport.
Guiding question: Which preparation steps prevent a punctual patient call-up – and which of them can be completed earlier or more reliably?
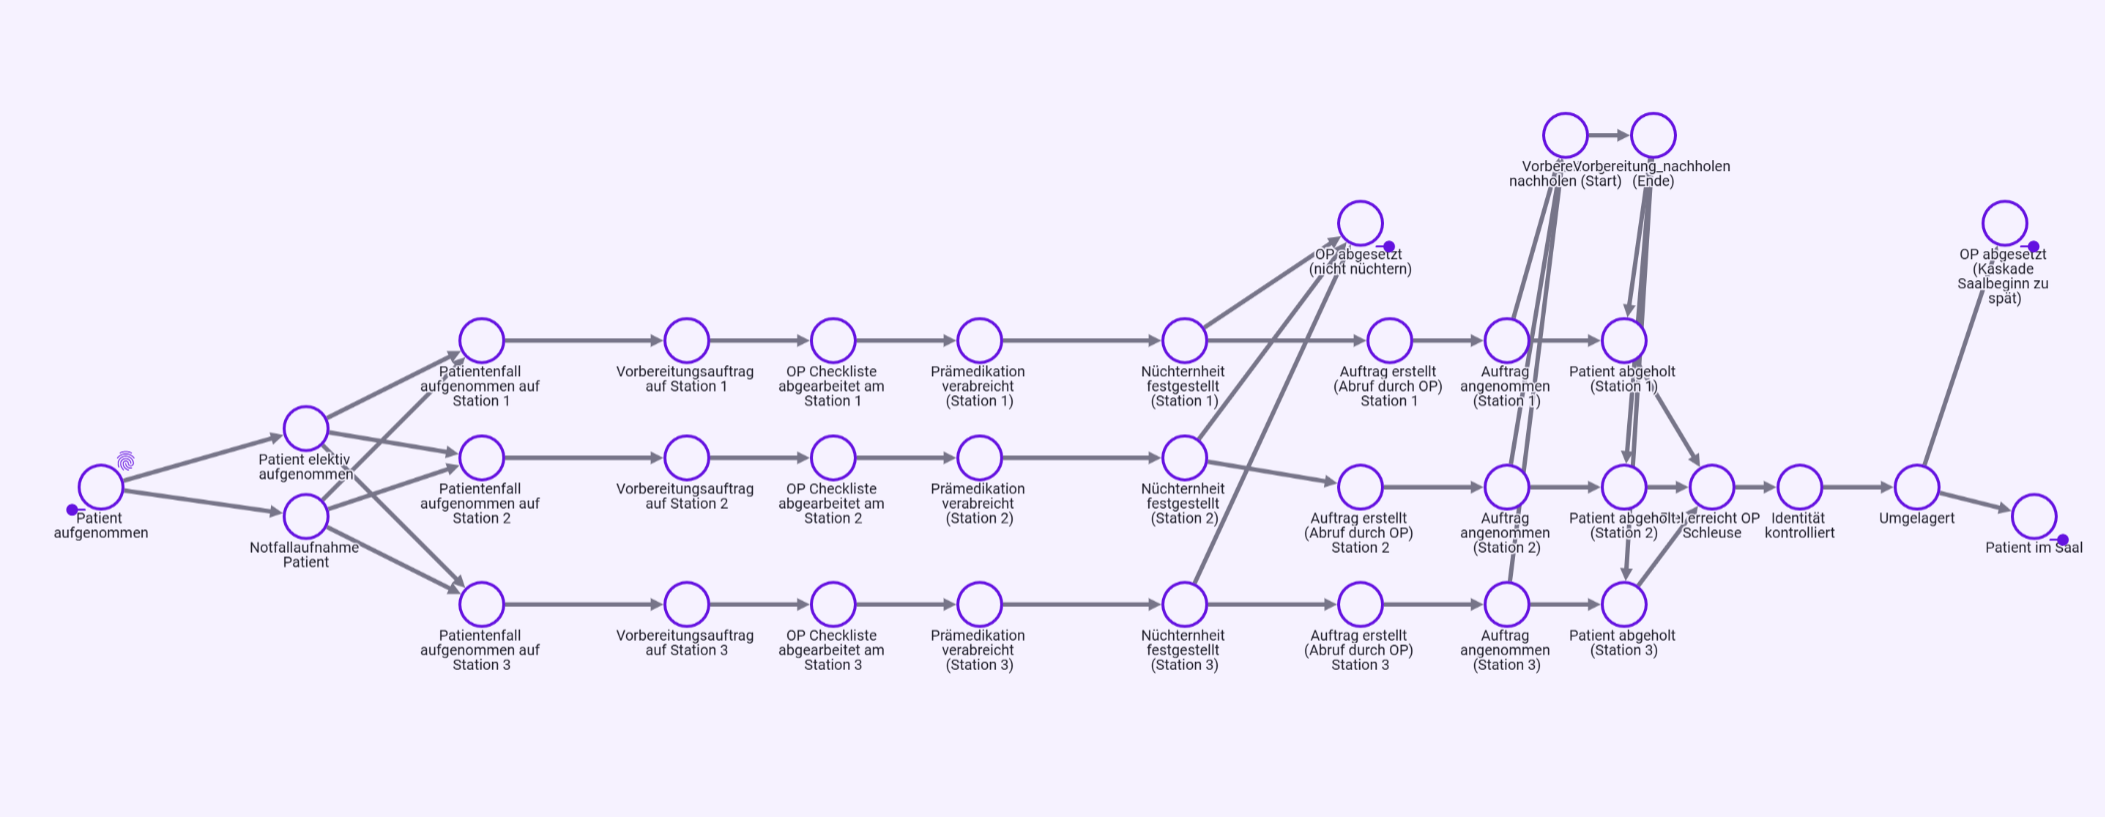
Preoperative preparation, patient call-up, transport and preparation steps completed late
2 · Induction, surgery and room management
In the second block, patient, operating room, anesthesia team and surgical team come together. Induction and procedure are followed by emergence, room exit (wheels out) and the transition to the next patient (turnover).
At first glance, delays here are easy to attribute to a team or a room. Longer induction times (anesthesia induction time), conspicuous turnover times or late starts look like clear performance problems. But different patient groups, surgical specialties or usage patterns can significantly influence these metrics.
In addition, the individual procedures do not stand in isolation. If an early case is delayed, this deviation can build up across several subsequent operations.
Business objects: patient, surgical case, operating room, anesthesia team, surgical team, surgical specialty, preceding and subsequent procedure.
Guiding question: Does the delay actually arise in the operating room – or do we only see there the effect of a cause that arose earlier?
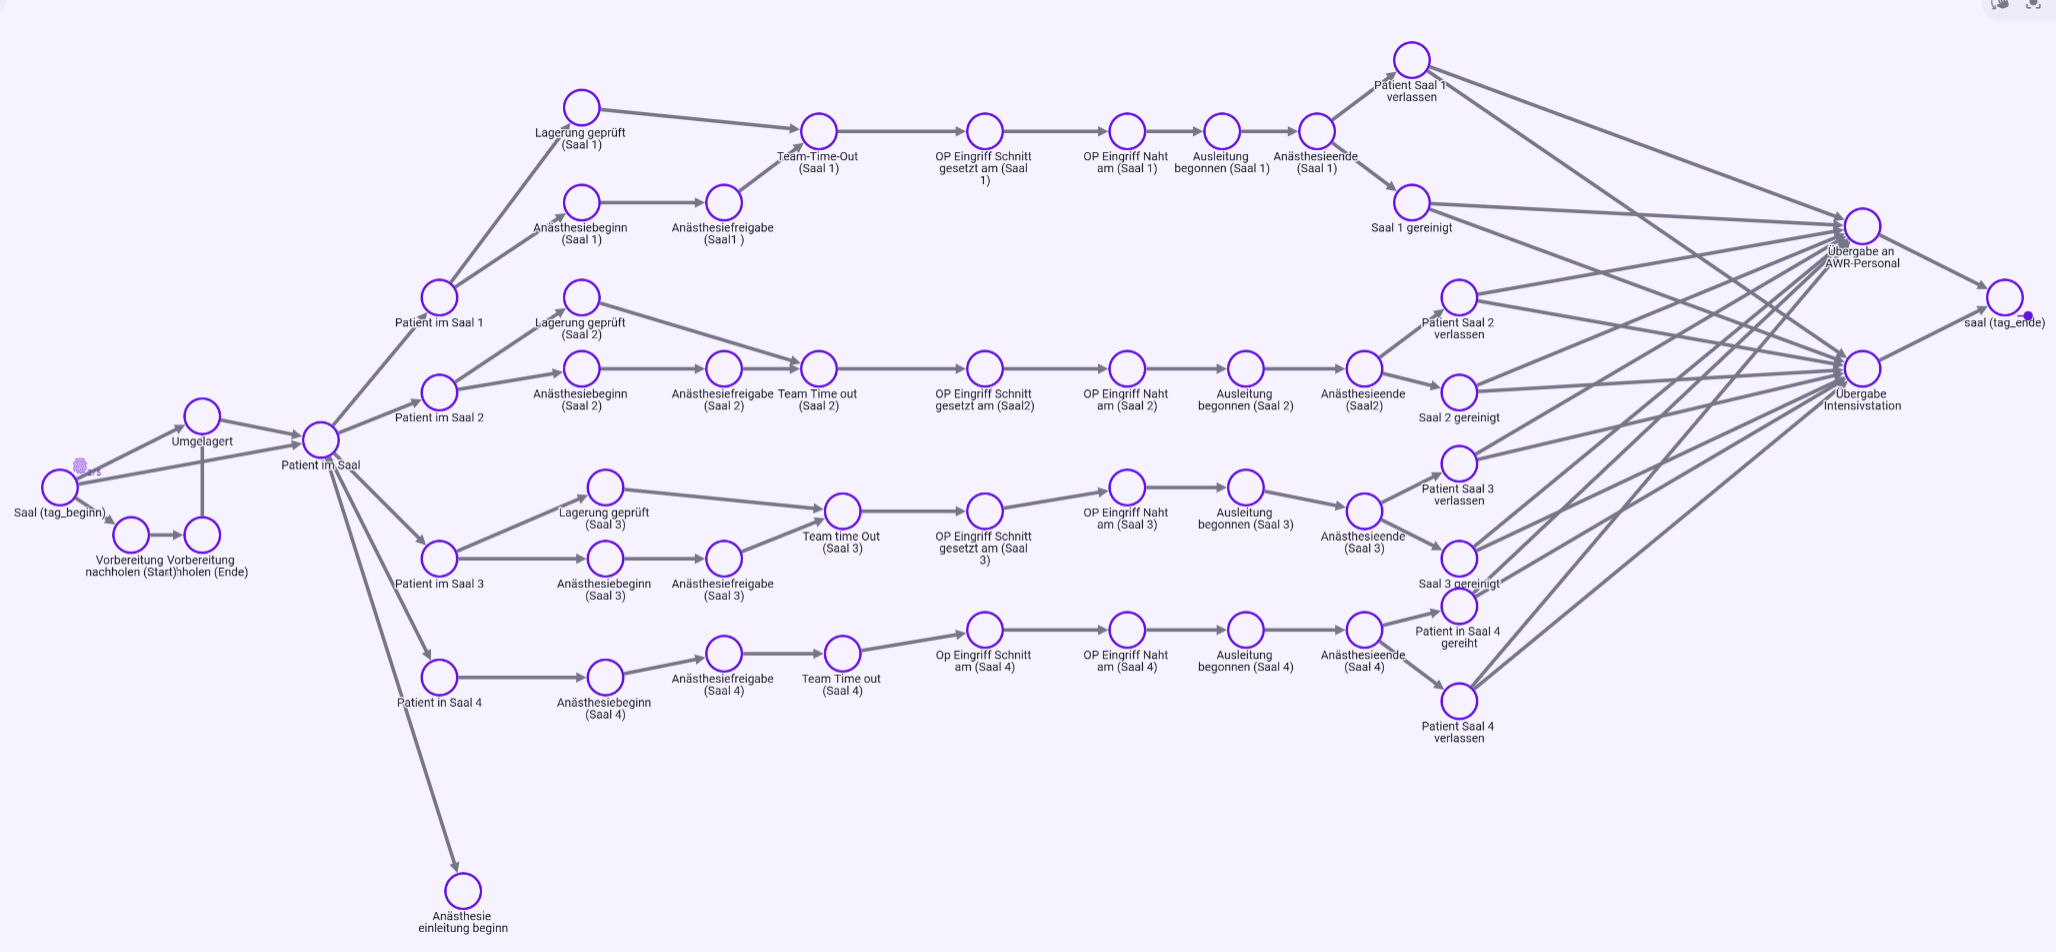
Induction, surgery, room occupancy and cross-case delay cascades
3 · Recovery room, bed and transfer back to the ward
After the procedure, the process does not end with the room exit. Many patients are first cared for in the recovery room (PACU) and then transferred to a ward or the ICU. For this, a PACU bay, transport and a suitable bed must be available at the right time.
If a patient is medically ready for transfer but no bed has been reported yet, the PACU bay remains occupied. If the recovery room is at capacity, the next patient may not be able to leave the operating room (PACU hold). A delay that arises on the ward can thus back up through the recovery room all the way into the OR.
This is exactly why shared resources must be considered across individual patient cases.
Business objects: patient, surgical case, recovery room, PACU bay, transfer clearance, ward bed, ward, ICU, patient transport.
Guiding question: What actually keeps the patient in the recovery room after transfer clearance – the missing bed, the transport or another bottleneck?
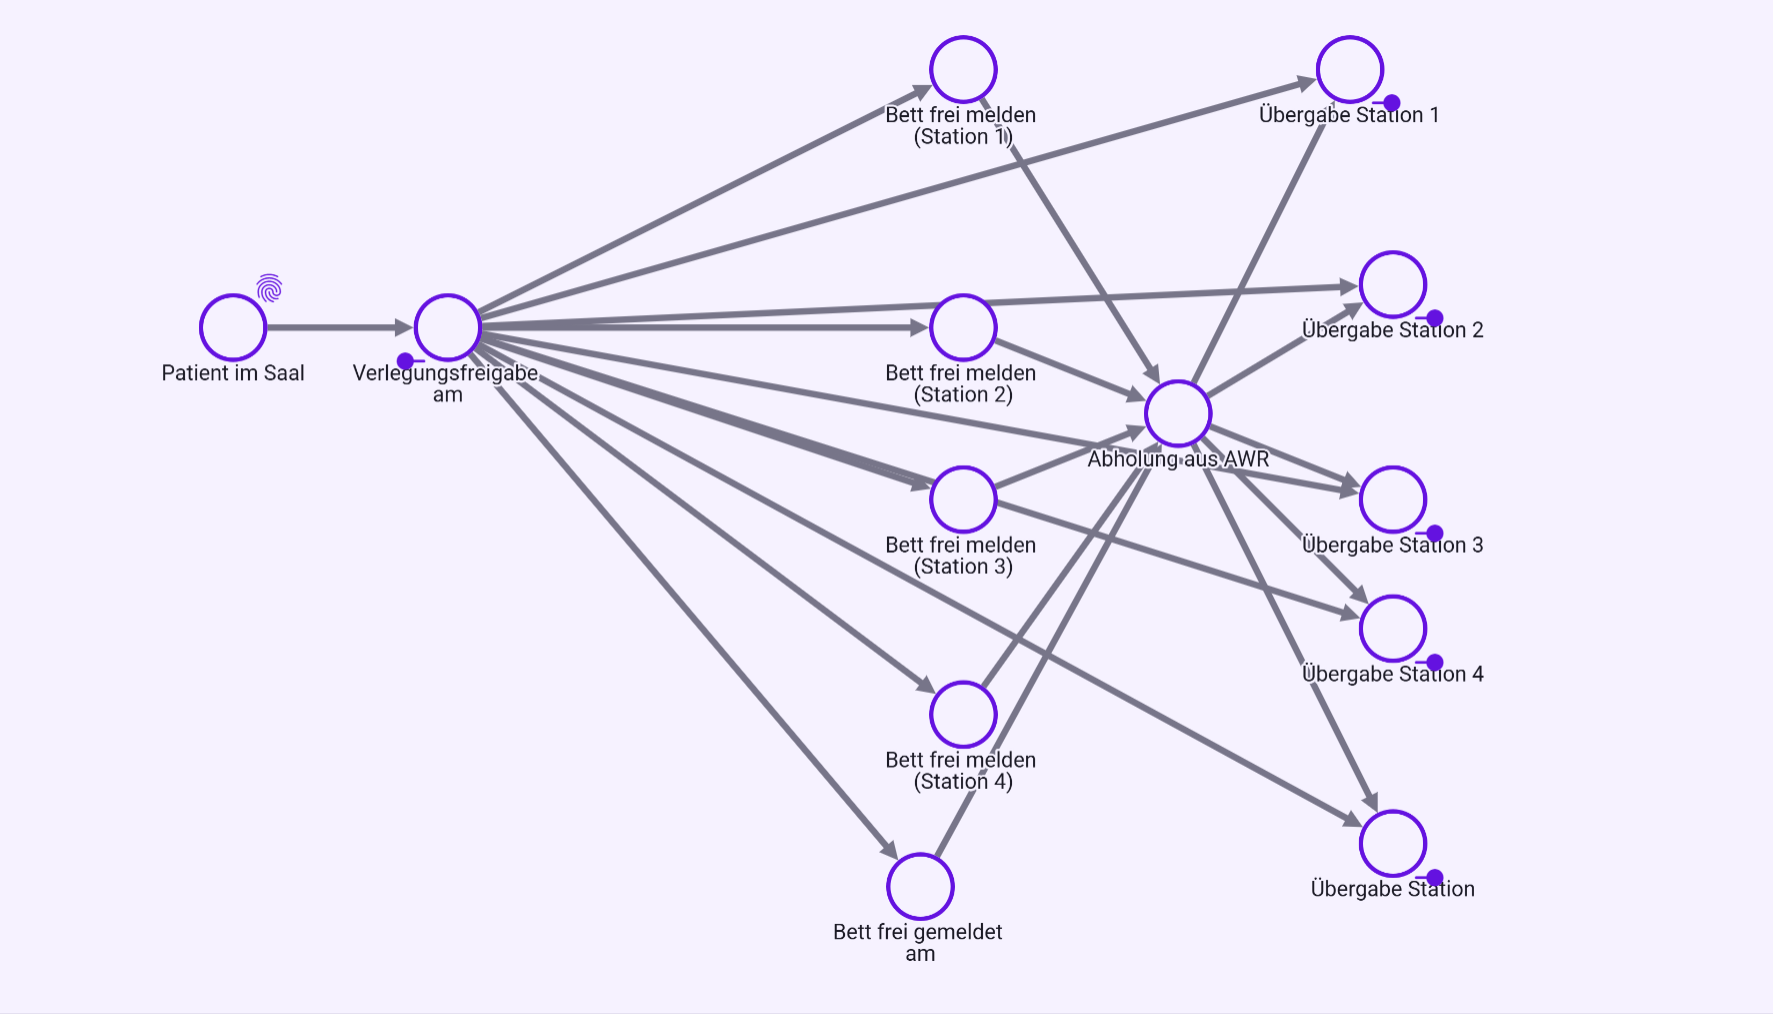
Backlog between recovery room, bed release notification, patient transport and operating room
Looking only at the individual surgical case shows a sequence. Looking at the connected patients, resources and events reveals the cascade behind it.
A look at the metrics
Before we search for causes, it is worth looking at what first becomes visible in the management dashboard.
| Metric | Result | Context |
|---|---|---|
| Surgical cases | 2,400 | synthetic dataset |
| On-time first room entries (FCOTS, first case on-time start) | 67.2 % | within 15 minutes of the scheduled room entry (wheels in) |
| OR holds (PACU holds) | 431 | documented holds |
| Blocked OR capacity | 374.1 h | cumulative hold time; not automatically avoidable 1:1 |
| Cancelled procedures (same-day cancellations) | 143 | of which 107 due to lack of time, 36 due to patients not fasting (NPO violation) |
| Procedures after 3:30 pm (overruns) | 514 | local hospital time |
The metrics paint a clear picture: only 67.2 % of first cases start within 15 minutes of the scheduled room entry. 431 procedures are affected by an OR hold – resulting in a total of 374.1 hours of blocked OR capacity. 514 procedures end after the scheduled room end time of 3:30 pm. In addition, there are 143 cancelled procedures, 107 of them due to lack of time.
So the problem seems clear: The OR is losing time and capacity.
The more interesting question, however, is: Where does this loss actually arise?
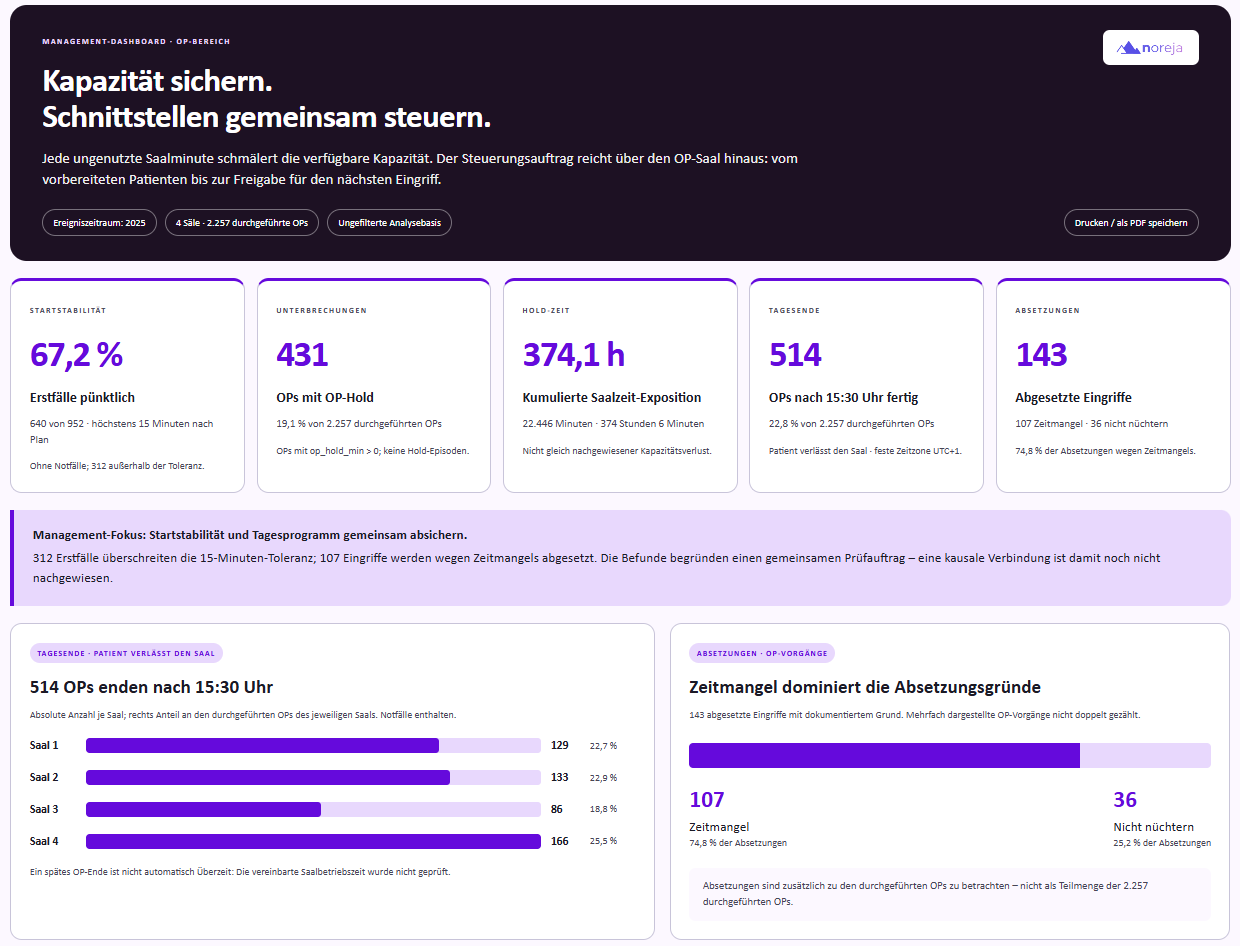
Management dashboard – on-time first cases, holds, blocked room time, cancelled procedures
Conspicuous relationships – but are they causes?
The first analyses show several conspicuous relationships. Certain teams, rooms or resource situations differ significantly in their metrics.
That is a good starting point for hypotheses – but not yet evidence of cause and effect.
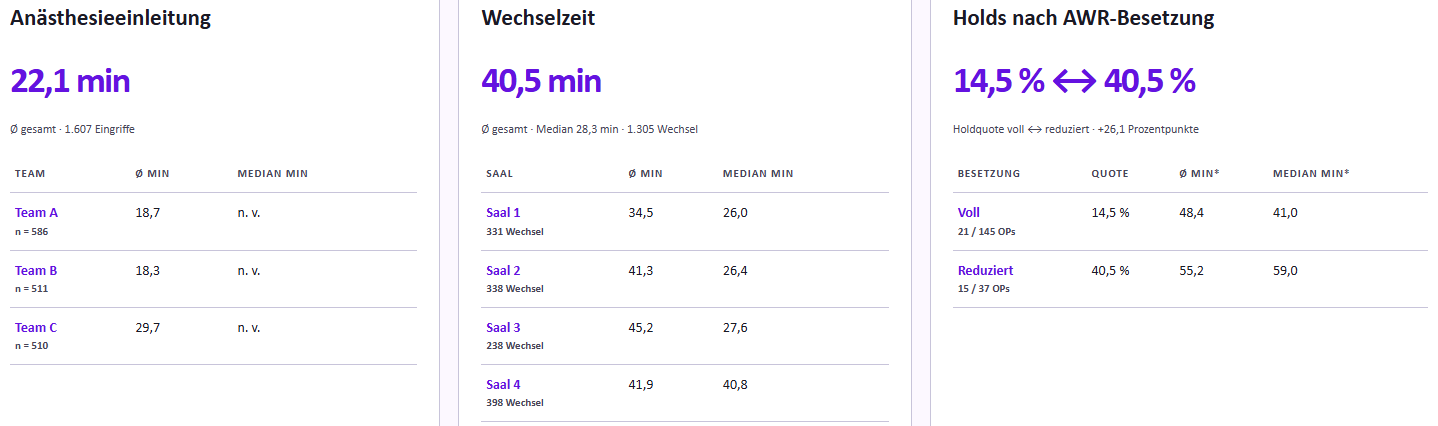
Overview of conspicuous relationships in the perioperative process
Correlation 1 · Anesthesia team performance
In the unadjusted comparison, team C needs an average of 29.7 minutes for induction. Team A is at 18.7 minutes, team B at 18.3 minutes. This looks like a clear performance difference.
Business question for Minerva: Why does anesthesia induction take longest for team C?
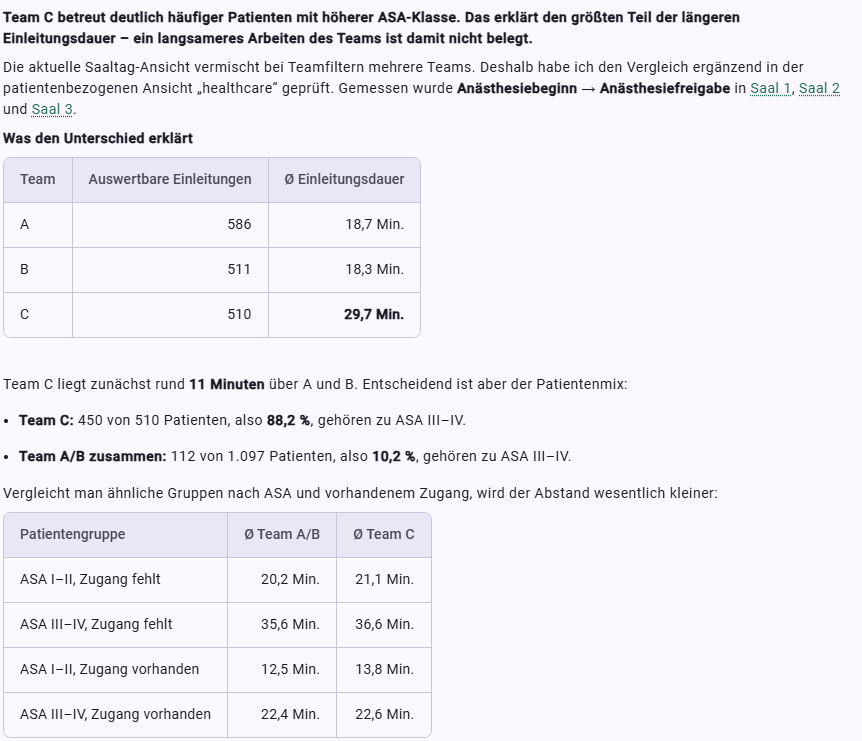
Team C – comparison of induction times | patient mix / ASA (ASA physical status) and comparison of comparable groups
The longer average induction time was real. The conclusion that team C is the cause was not. The difference is largely explained by the patient mix (case mix).
Correlation 2 · OR turnover time
Room 4 also stands out in the metrics. Its turnover times differ from other rooms and the median is significantly higher. Again, a simple explanation suggests itself: Room 4 works inefficiently.
Business question for Minerva: Is room 4 actually slower? Analyze how the room is used.
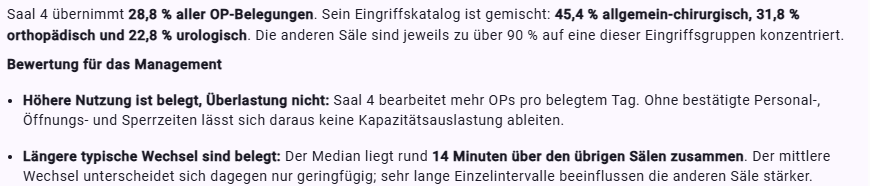
Room 4 – turnover times | usage mix
But here, too, a second look pays off. Room 4 is used differently from the other rooms and takes cases from several surgical specialties. This creates different requirements for setup, coordination and turnover.
This makes room 4 a planning and analysis point, but not automatically an inefficient room. The average individual occupancy hardly differs; the measured occupancy between first entry and last exit is also of a similar magnitude to that of the other rooms.
Correlation 3 · Staffing in the recovery room
The third suspect seems particularly plausible: with documented reduced PACU staffing, the hold rate is 40.5 %, compared with 14.5 % with full staffing.
The temptation to derive a measure directly from this is great: more staff in the recovery room.
Business question for Minerva: Why is the PACU occupied at the time of the hold? Is the bottleneck really staffing – or somewhere else in the resource chain?
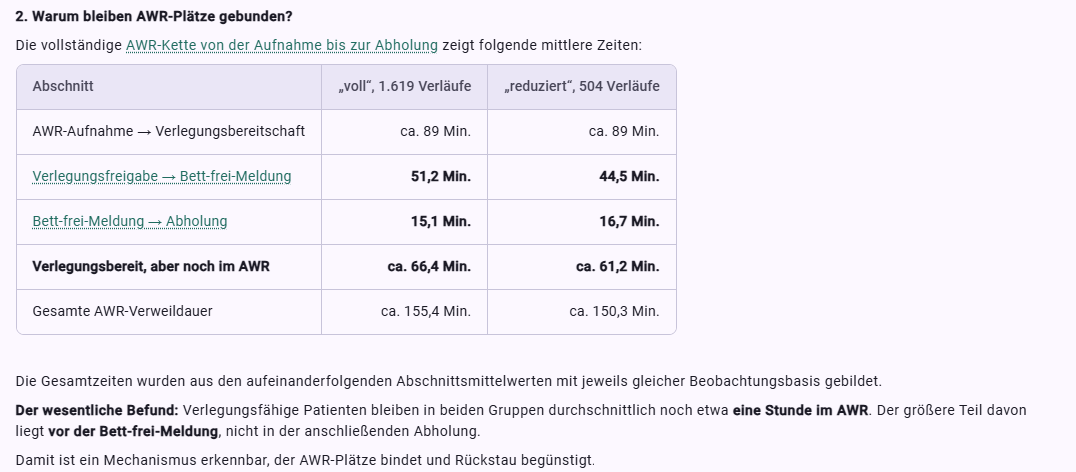
PACU staff – hold rate with full/reduced documented staffing, with a methodological note
From conspicuous metrics to robust causes
Train team C. Optimize room 4. Put more staff in the recovery room. All three measures sound plausible at first. But the analysis shows: A conspicuous metric is not yet a cause.
The data was correct. The obvious conclusions, however, were not sufficiently justified.
If we want to understand why OR capacity is actually lost, we must therefore broaden our view: away from the individual KPI and towards the dependencies between preparation, patient flow, recovery room, bed and the preceding cases of an OR day. This is where the actual root cause analysis begins.
Cancelled procedures: where do the causes arise?
Of the 143 cancelled procedures, 107 were cancelled due to lack of time. "Lack of time", however, is not a root cause. It is the documented reason at the end of a chain of events.
Business question for Minerva: Analyze why operations were cancelled.
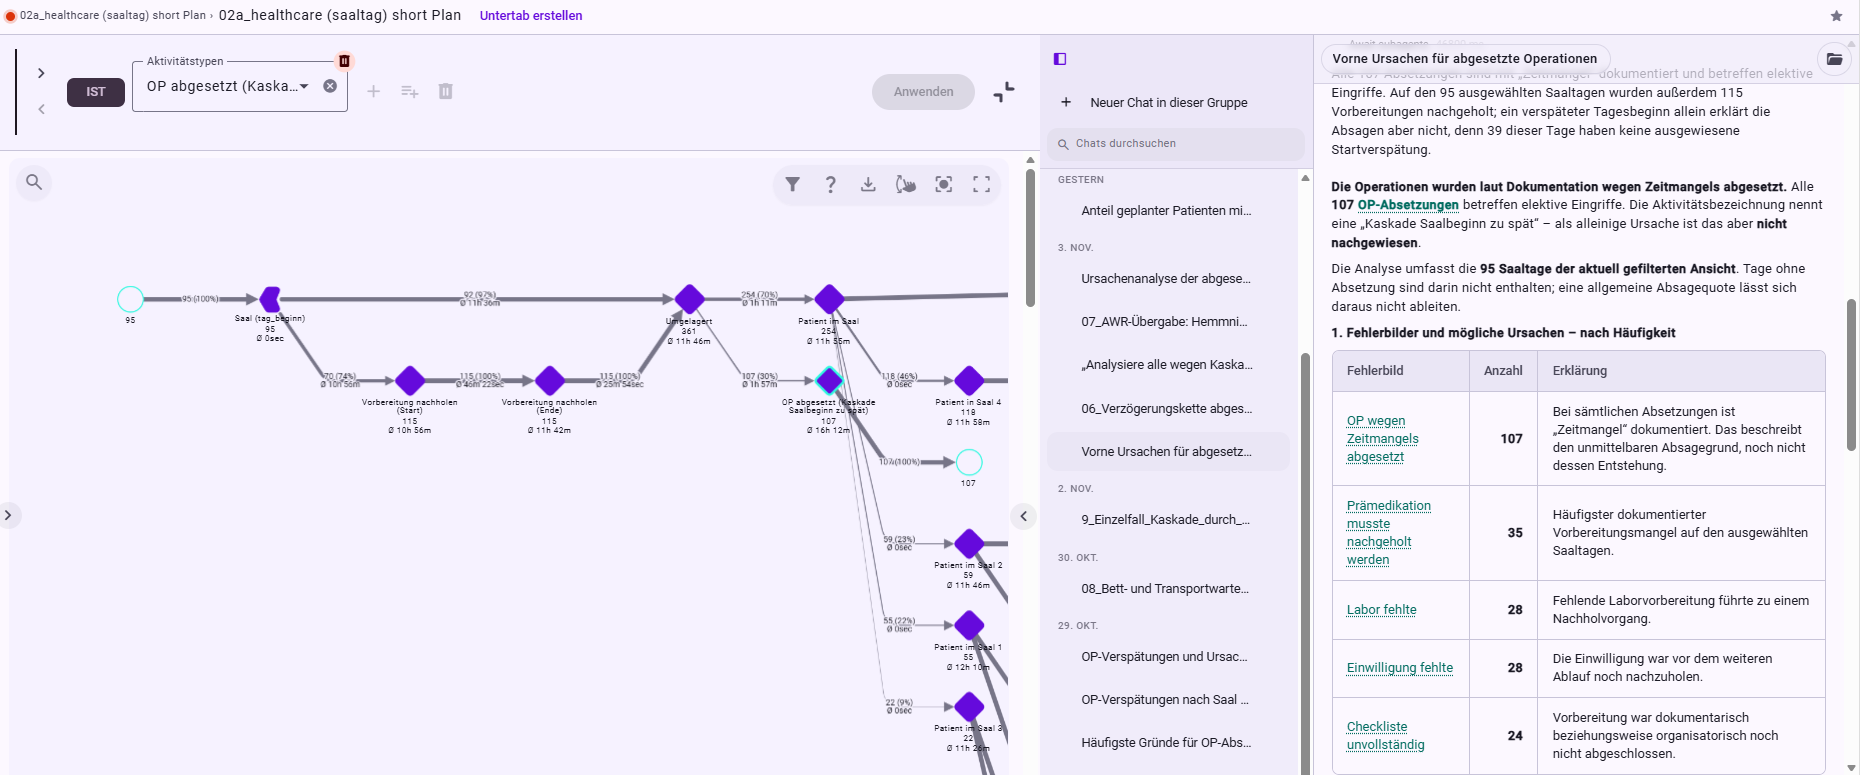
Procedures cancelled due to lack of time:
The 107 cases are spread across 95 OR days. To understand how the missing time arose, it is therefore not enough to look only at the cancelled patient. The analysis must include the preceding operations of the same OR day and the shared resources.
Business question for Minerva: Which preceding operations and resource conflicts contributed to the 107 procedures cancelled due to lack of time?
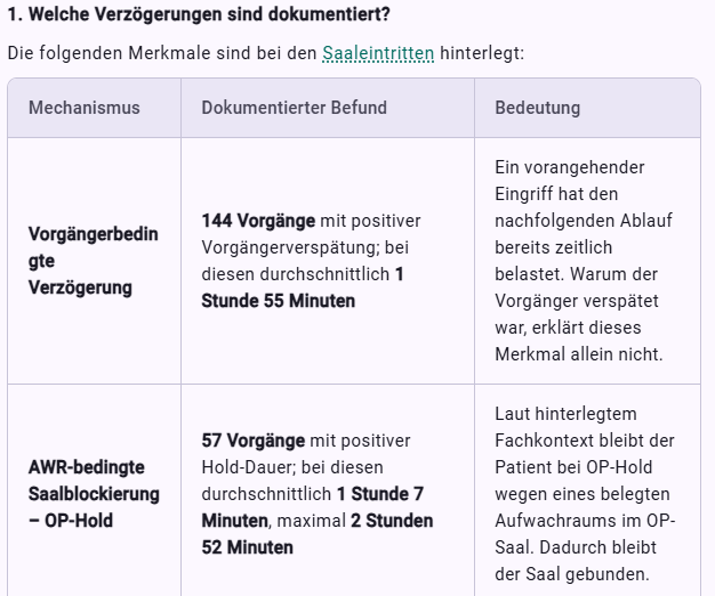
Cancelled procedures due to upstream and downstream sub-processes
The analysis of the affected OR days shows three recurring delay patterns:
- before surgery: preparation steps are completed late,
- after surgery: patients stay in the room longer due to OR holds,
- between procedures: delays from preceding cases carry over to subsequent operations.
The cause of a cancelled operation does not necessarily lie in the cancelled case itself. It may have arisen hours earlier and with a different patient.
That is why we now walk through the process step by step: preparation → PACU and bed → OR day and cascade.
When preparation has to be completed late
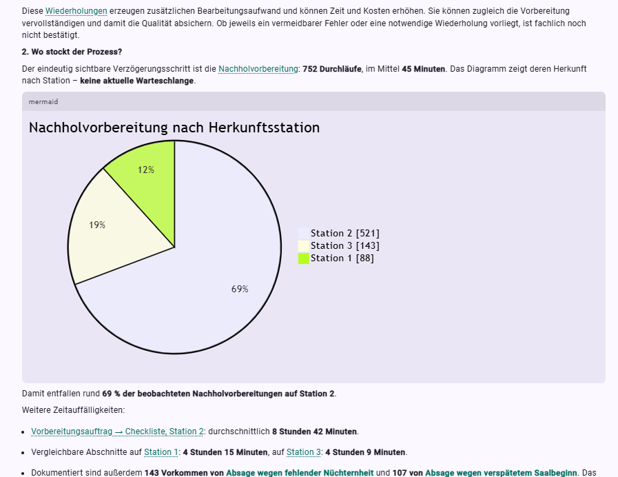
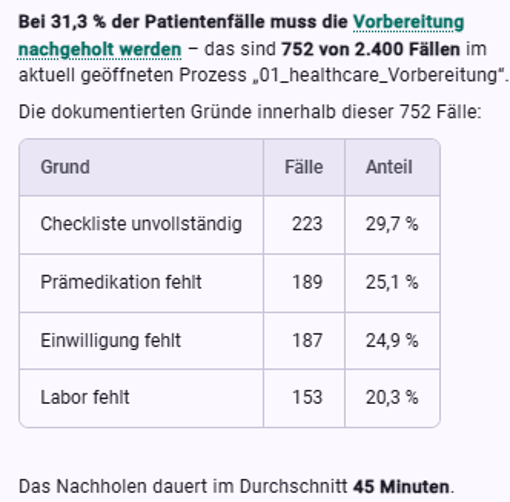
In 752 of 2,400 cases, preoperative preparation is completed late. That corresponds to 31.3 % of all cases. Completing it takes around 45 minutes on average.
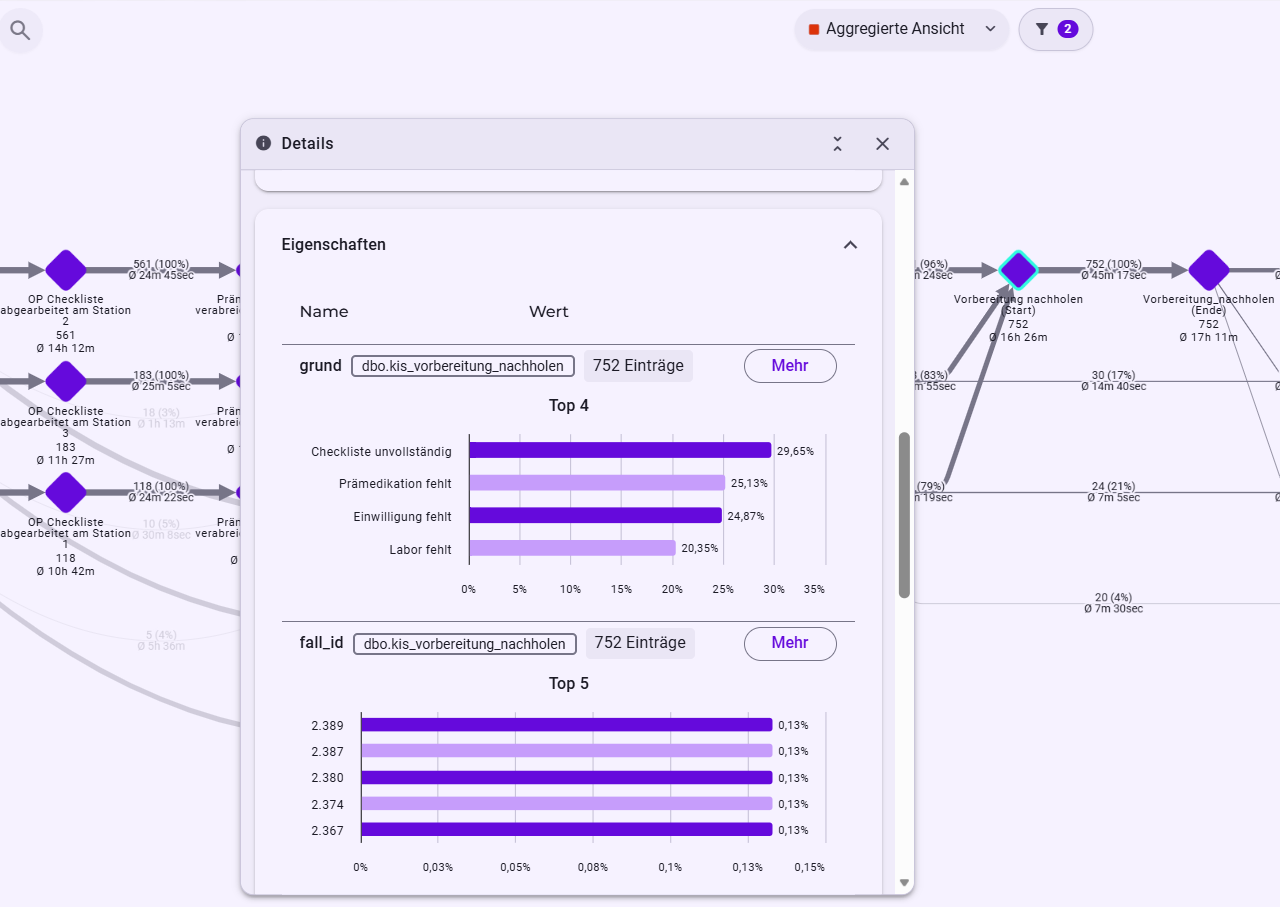
The documented reasons are specific:
| Reason for late completion | Cases |
|---|---|
| Checklist incomplete | 223 |
| Premedication | 189 |
| Informed consent | 187 |
| Lab | 153 |
The relationship is particularly clear for the first cases of the day:
- with preparation completed late: 26.3 % on time
- without preparation completed late: 91.8 % on time
- overall: 67.2 % on time
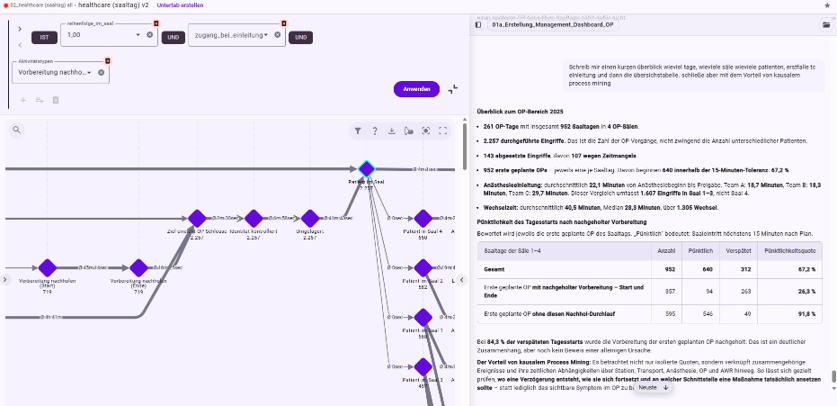
Impact of preparation | punctuality of first room entry (FCOTS)
Business question for Minerva: Which missing preparation steps drive late first room entries? On which wards do they occur particularly often?
When patient flow stalls after surgery
After the procedure, the patient should leave the OR, be cared for in the recovery room and then be transferred to the ward. But this is exactly where a delay can back up against the patient flow.
The analysis of the path transfer clearance → bed release notification → pick-up shows clear differences between the wards.
On ward 2, an average of 66.9 minutes pass between transfer clearance and bed release notification. On ward 3 it is 45.6 minutes, on ward 1 only 19.3 minutes. The subsequent transport, by contrast, takes a comparable 15–16 minutes on all three wards.
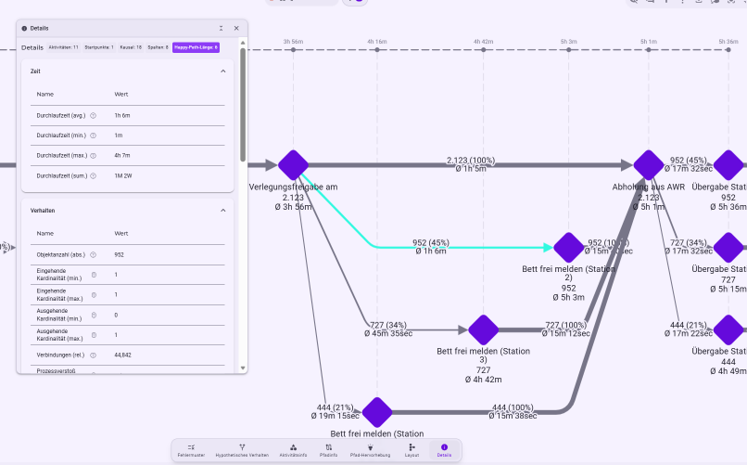
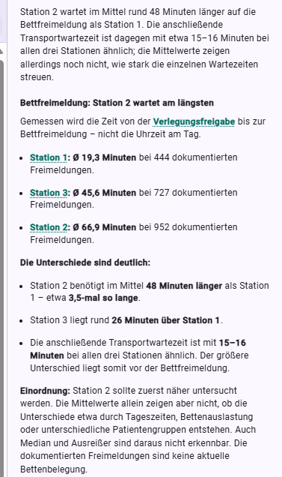
Analysis of the waiting time between transfer clearance, bed release notification and pick-up by ward
A pattern behind the waiting times
Looking at the times of the bed release notifications reveals another pattern: the wards release their first beds at different, recurring times. In the demo dataset, this time is often around 12:00 noon on ward 1, 1:00 pm on ward 3 and only 1:30 pm on ward 2.
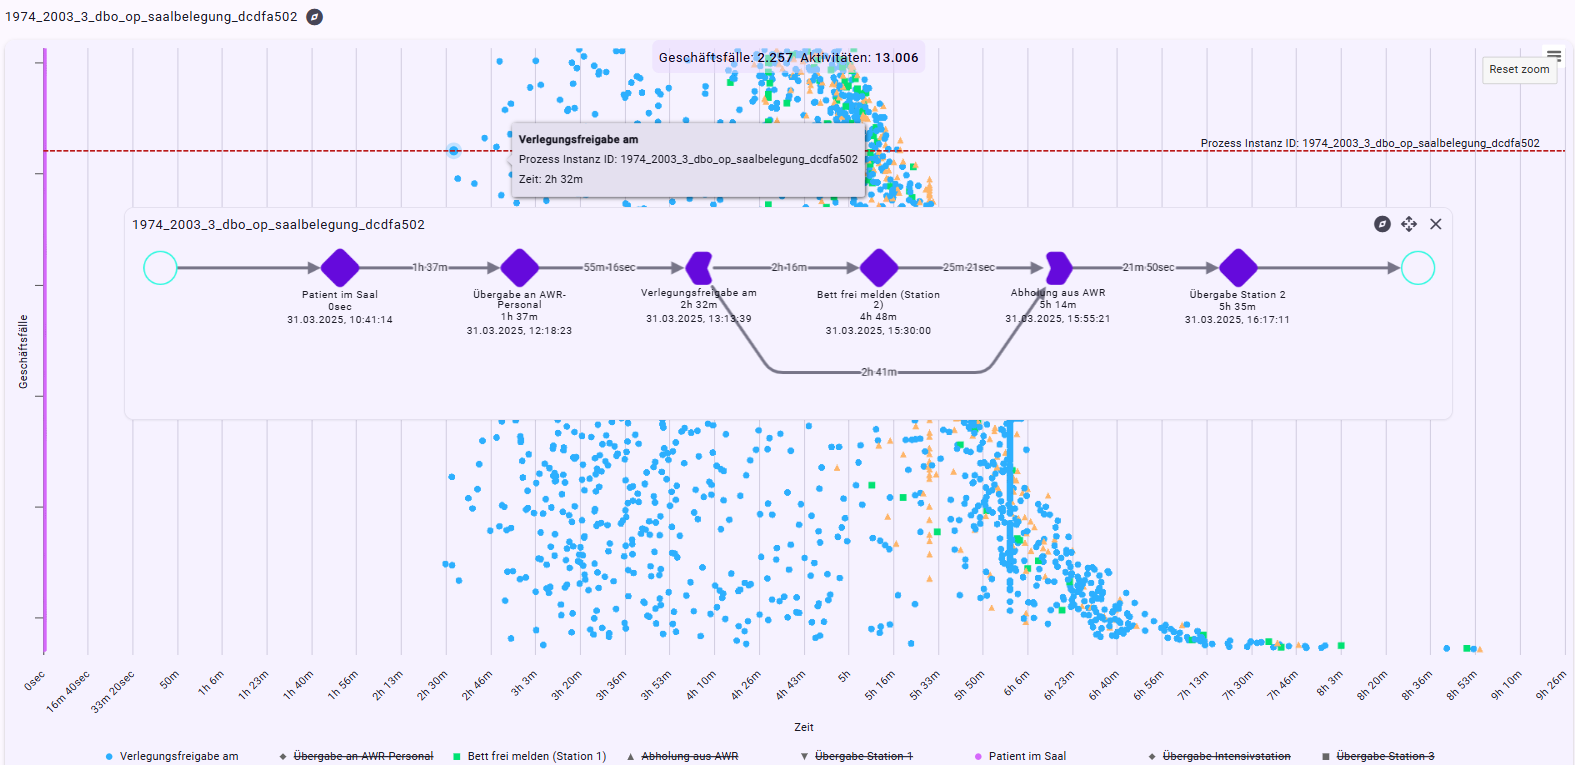
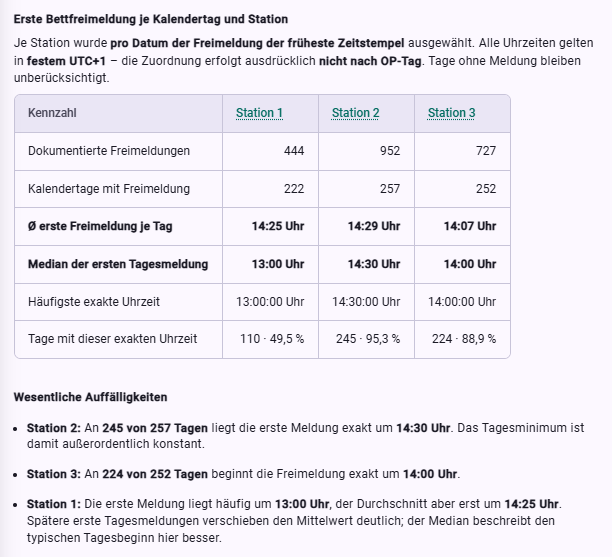
Ward-specific patterns of bed release notification over the course of the day
This matters for the OR: if a patient who is medically ready for transfer is not moved on, their PACU bay remains occupied. If the PACU fills up, the backlog can reach into the OR and a subsequent patient may not be able to leave the room in time.
A delay on the ward can thus become visible where you would not initially expect it: in the operating room.
The OR backlog arises between cases
The two main mechanisms run in opposite directions.
The delay runs with the patient flow
Delays do not necessarily stay with the patient where they arise. If several procedures use the same operating room one after the other, a late start can propagate from case to case through the entire OR day (knock-on delay).
The OR day in room 4 on 25 Nov 2025 shows this particularly clearly: for the first procedure, the checklist has to be completed late. The case starts with a 33-minute delay. For the next procedure it is already 74 minutes, for the third 110 minutes. Finally, the remaining room time is no longer sufficient for the last scheduled procedure, and it is cancelled due to lack of time.
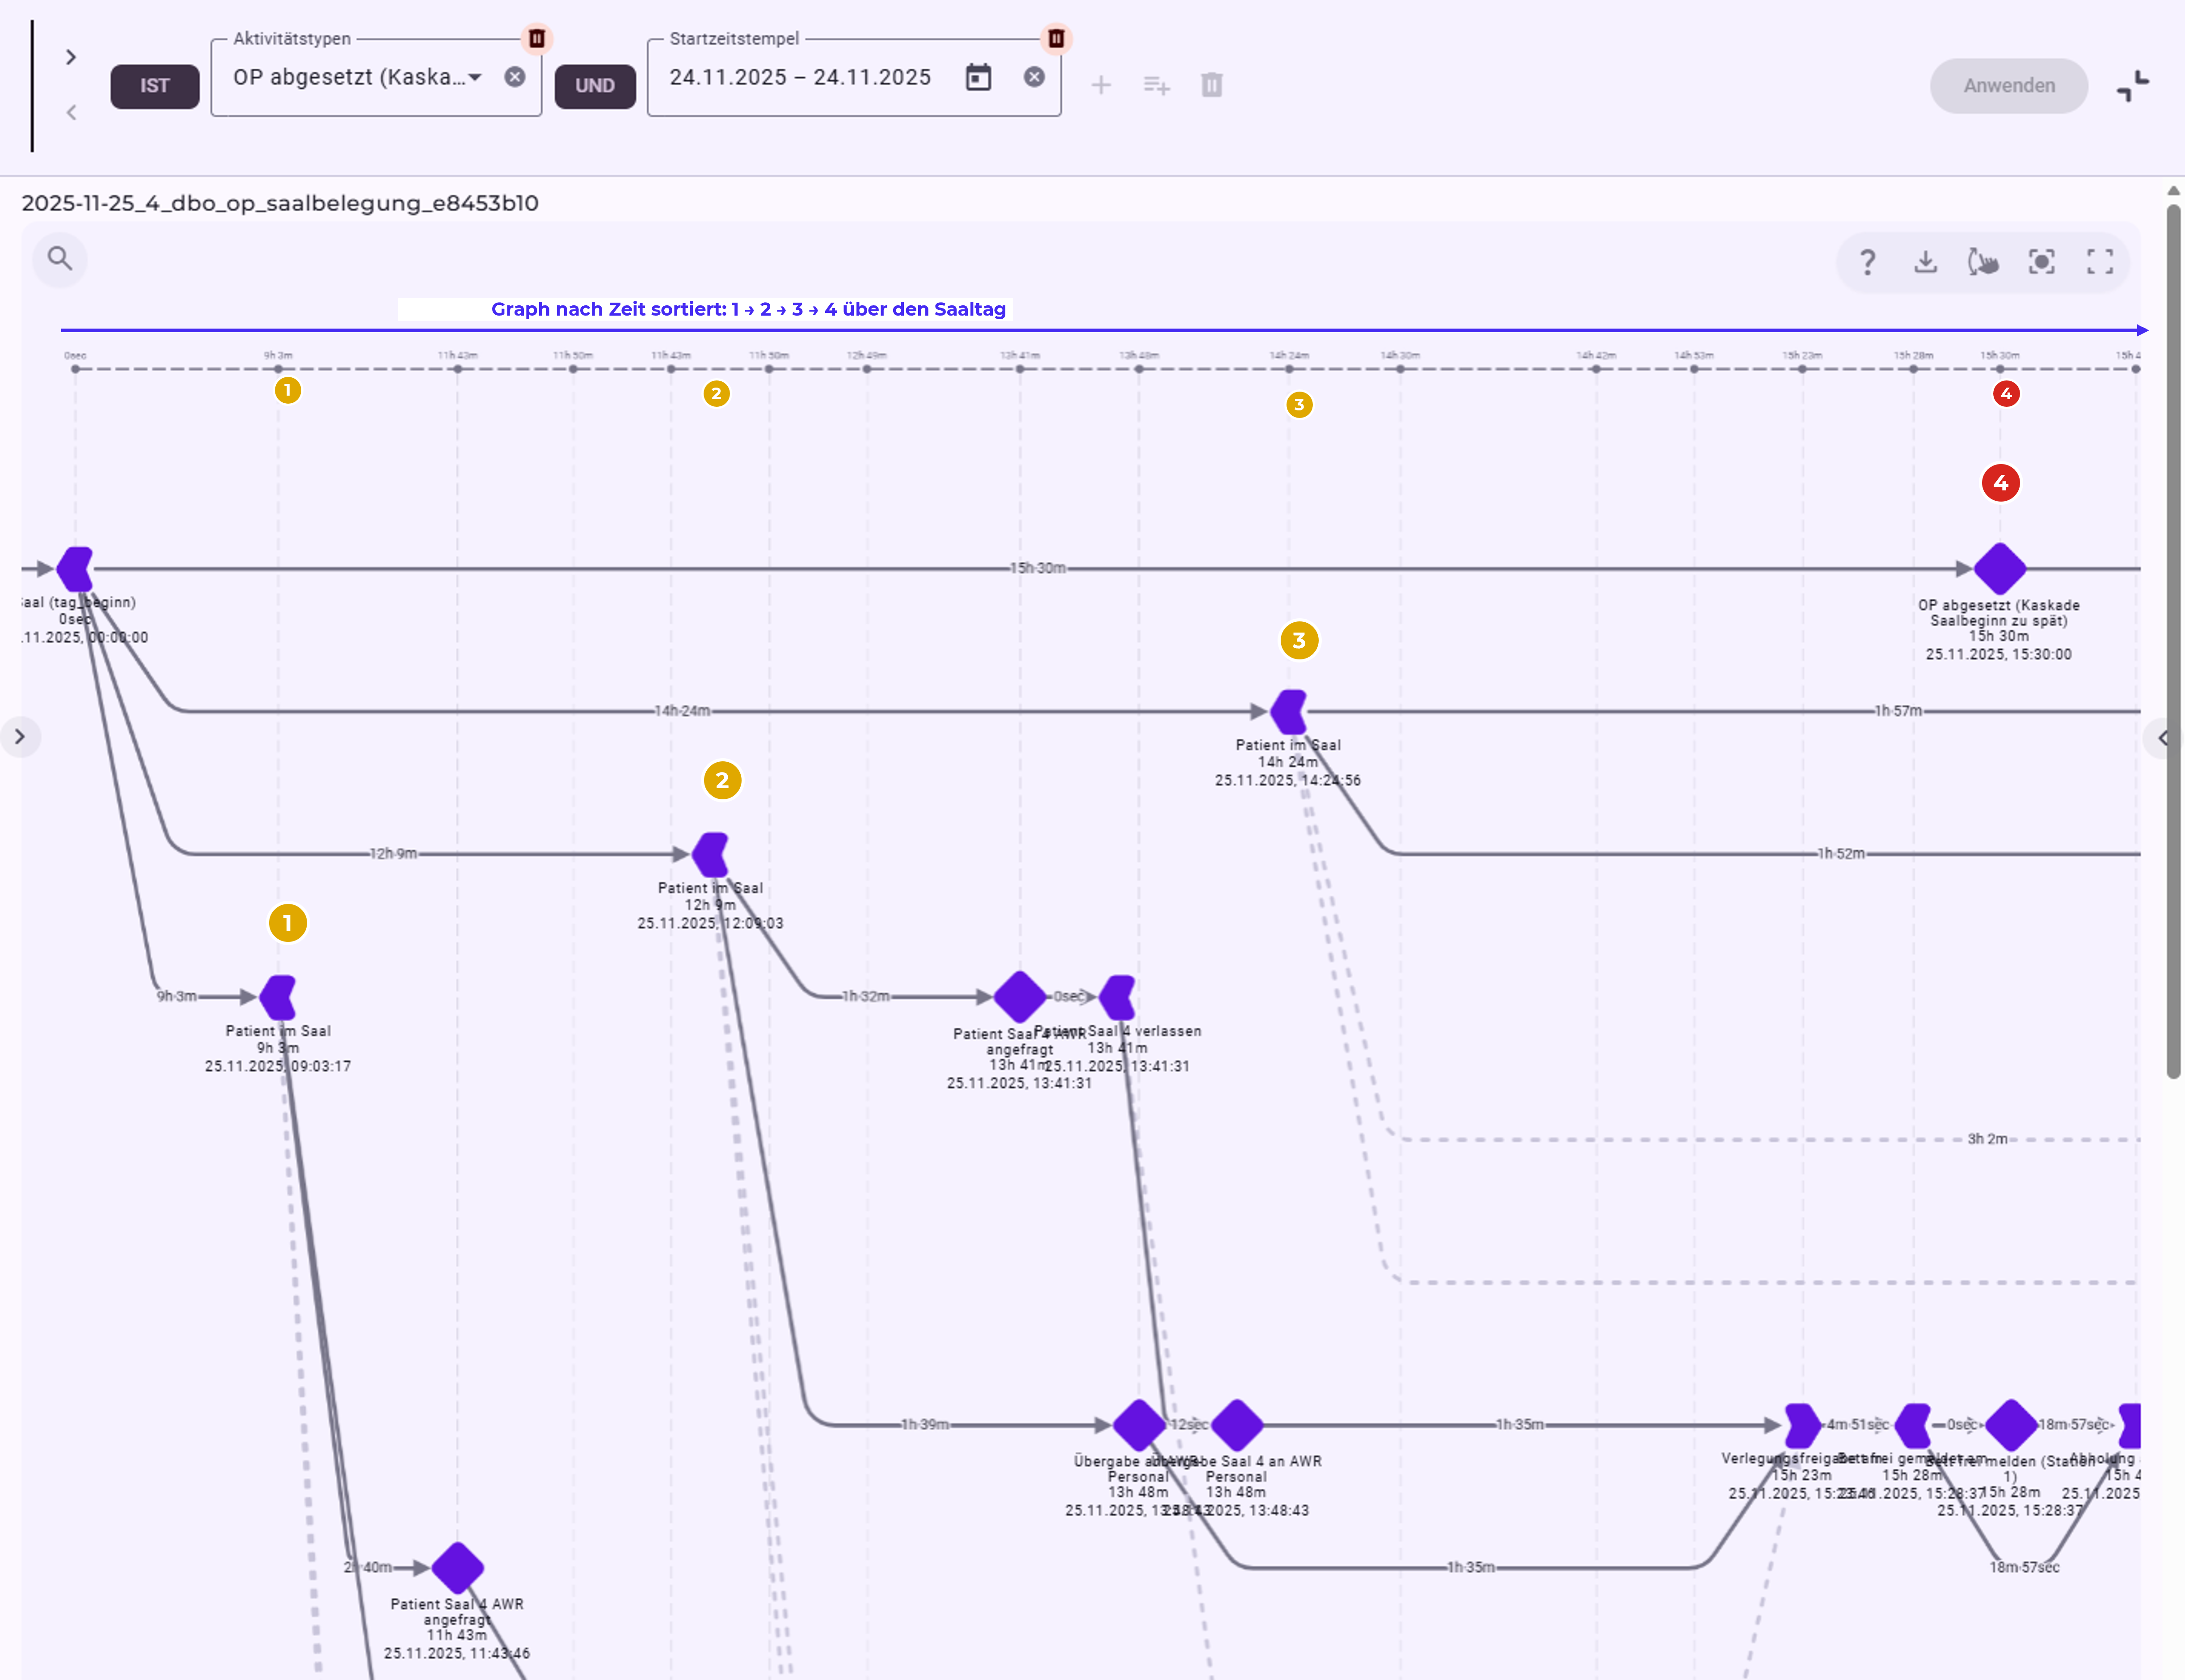
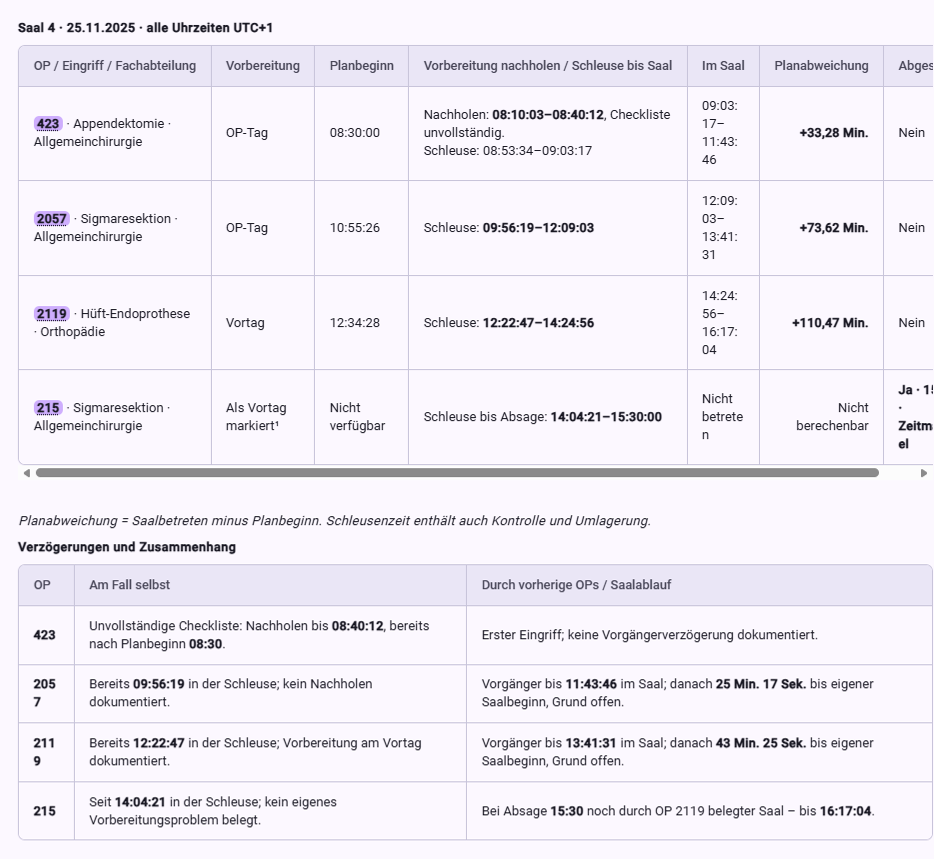
Four procedures, one cascade: a delay in the morning is passed on to the subsequent cases via the shared operating room.
The cancellation happens at the end of the day. The cascade, however, begins in the morning.
For the analysis, the perspective is therefore decisive. If each procedure is viewed only as an individual case, the last patient mainly shows the cancellation. In the OR day perspective, by contrast, the preceding cases and the shared operating room become visible, and with them the chain through which the delay is carried forward.
The blockage backs up against the patient flow
A delay can not only move with the patient flow through the OR day. It can also back up against the direction of the process.
It starts at the end of the patient pathway: a patient in the recovery room is ready for transfer, but the ward bed has not yet been reported. The patient stays in the PACU, the bay stays occupied. If all PACU bays are taken, another patient cannot leave the operating room – and the room remains on hold (PACU hold).
A concrete OR day shows how this can turn into a cross-case blockage.
Several patients wait for a ward bed after their transfer clearance. As a result, PACU bays remain occupied. In the example shown, a delayed pick-up adds to this. In the end, several operating rooms are affected at the same time – with holds of 59, 42 and 60 minutes.
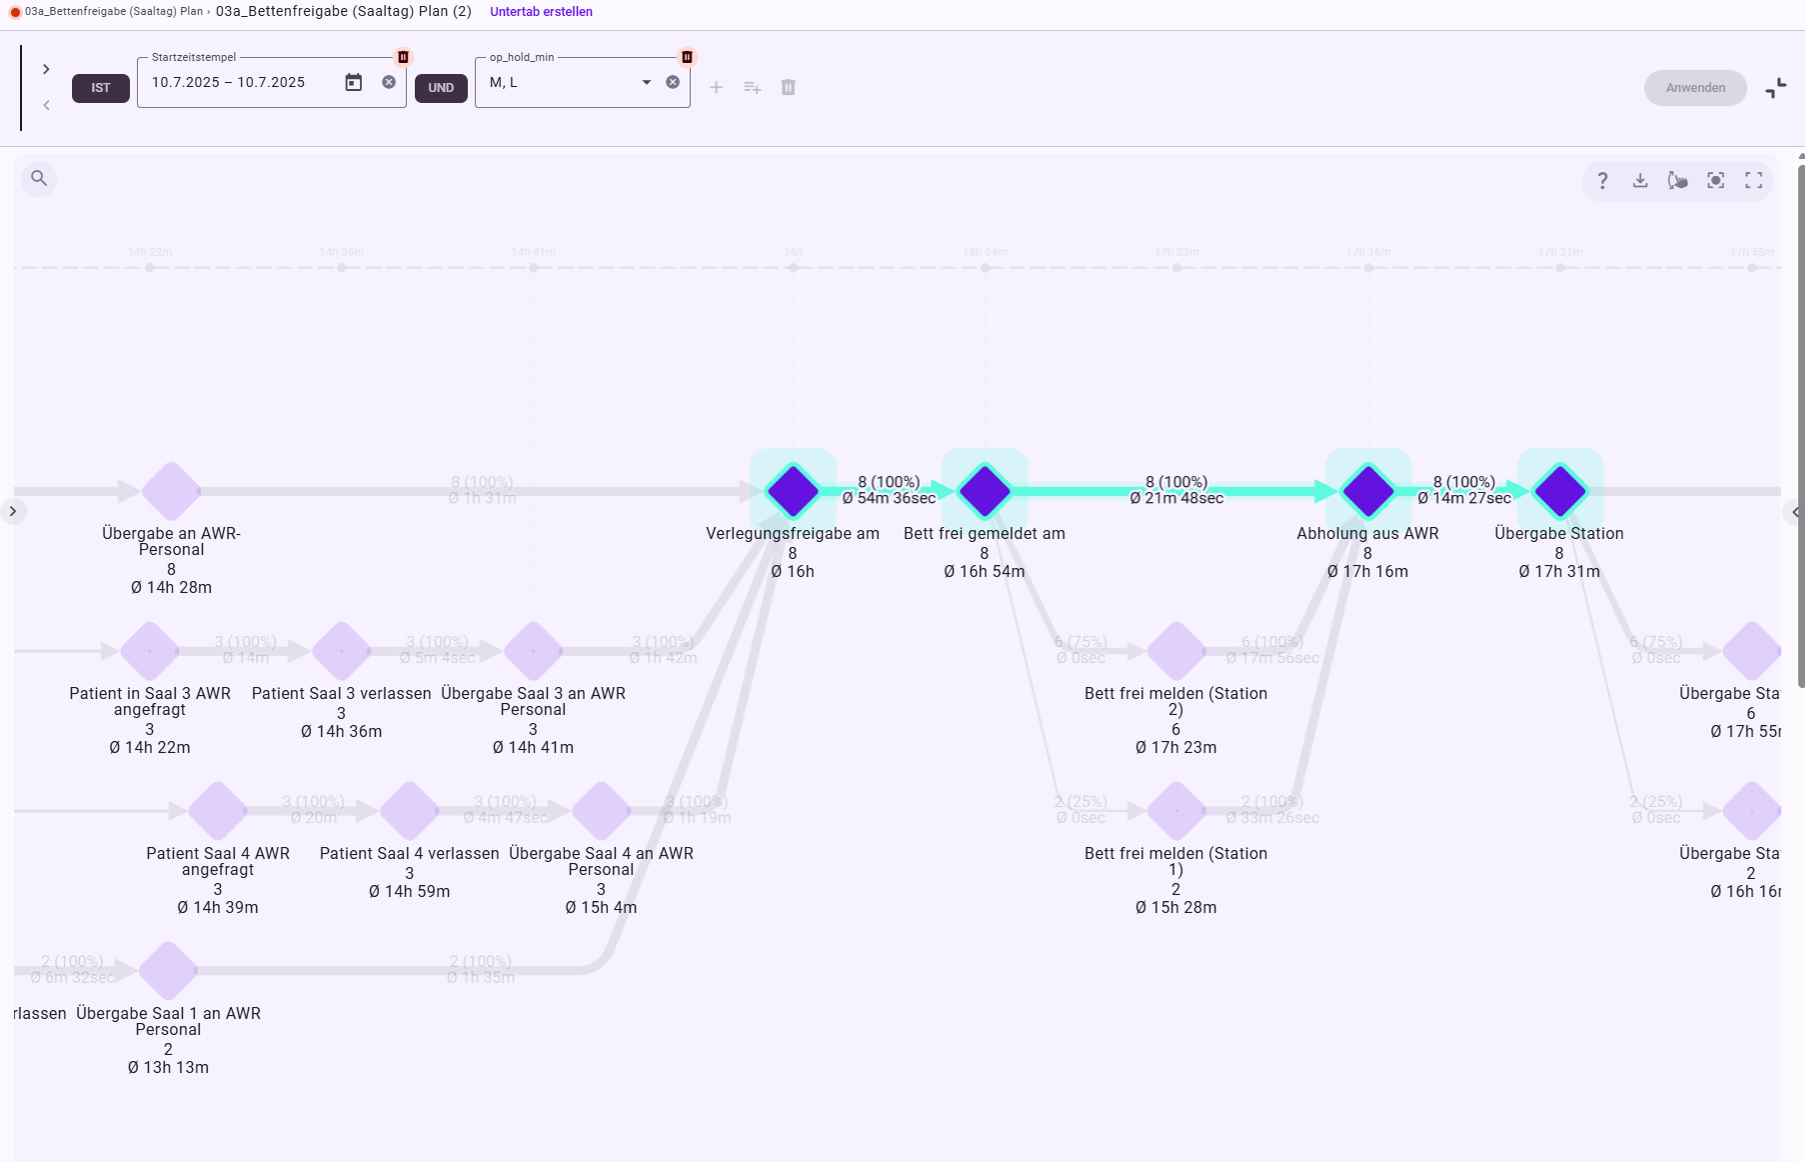
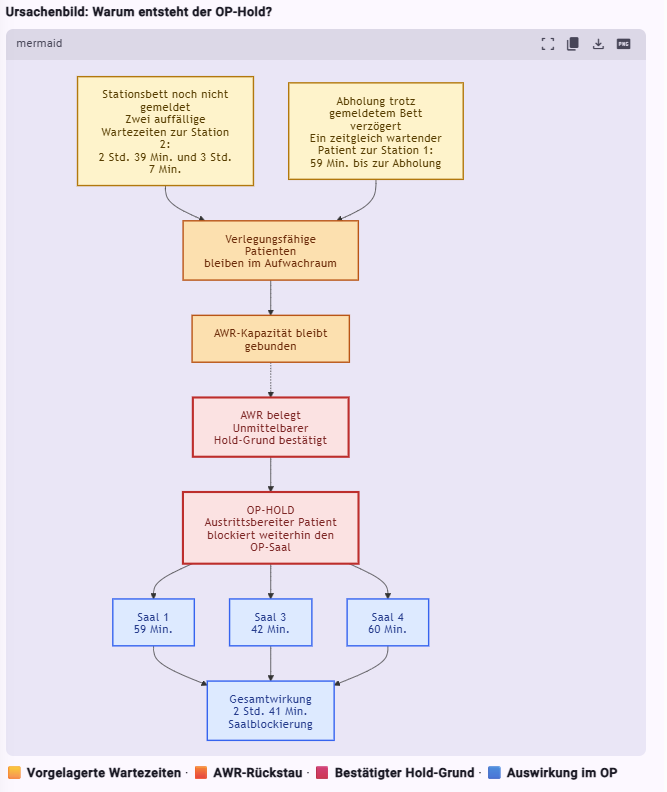
Backlog chain: delayed bed release notification and pick-up → PACU bays remain occupied → patients cannot leave the operating room.
The two examples lead to the core of the use case:
A delay can run with the patient through the process – or back up against the patient flow via shared resources. In both cases, the visible cancellation can occur hours later with a different patient.
Four triggers – the same consequence
The analysis shows four recurring triggers:
- incomplete preparation → completed late before transport or room entry → later start,
- occupied PACU / missing bed → patient cannot be transferred → later room exit,
- emergency add-on case → planned sequence and available capacity change,
- batched bed release notifications → wards release beds at different, recurring times; as a result, patients ready for transfer sometimes stay longer in the PACU.
Business question for Minerva: Summarize the causes of the cancellations due to lack of time.
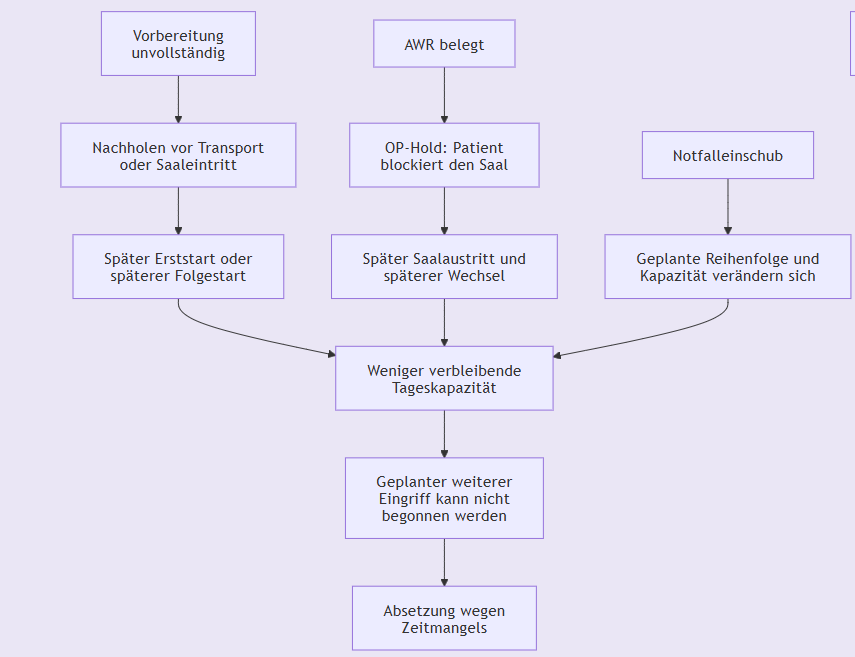
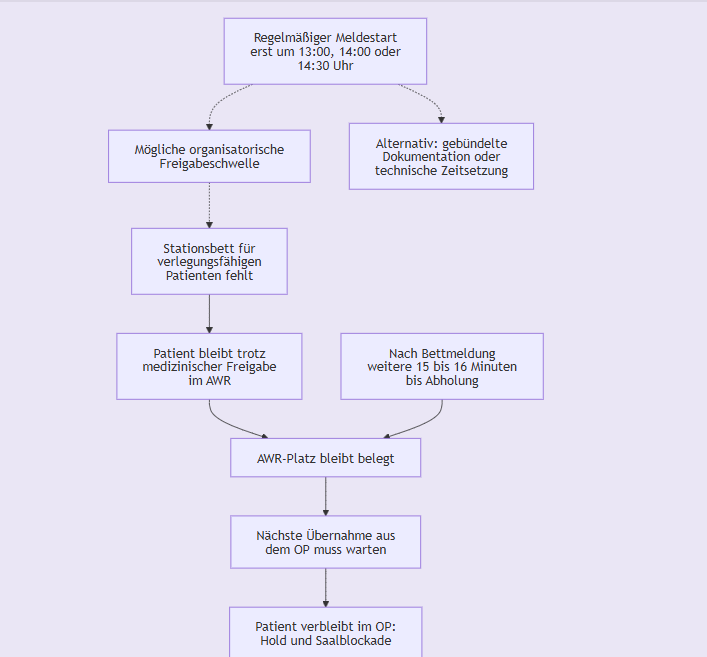
Four triggers can start a delay chain that ultimately leads to surgery cancellation and room blockage
What begins differently leads to the same effect: subsequent procedures slip backwards and the remaining daily capacity decreases. If it is no longer sufficient for another scheduled procedure, that procedure is cancelled due to lack of time.
From finding to prioritized measure
A finding does not yet change a process. After the analysis, the process owner must decide which insights should actually be addressed and which measure makes sense from a business perspective.
This is where the bridge to the Business Impact Board comes in: findings are not just collected but assessed, for example, by expected impact, implementation effort, risk and uncertainty. Process Excellence and the business department can thus jointly prioritize which decision hypothesis is implemented as a pilot and which deliberately follows later.
Example fields of action
For the perioperative patient pathway, the analyses condense into four central findings:
| Finding | Insight | Possible lever |
|---|---|---|
| F-002 · Bed release notification and PACU backlog | Patients remain in the PACU after transfer clearance; ward-specific and batched bed release notifications can carry the backlog into the OR | Review the bed release notification process together with the wards |
| F-001 · Preoperative preparation | If preparation has to be completed on the day of surgery, first procedures start late much more often | Fully complete preparation before patient call-up |
| F-007 · Incomplete preparation | In 31.3 % of cases, preparation steps are completed late | Check completeness of checklist, premedication, informed consent and lab before call-up |
| F-004 · Specialty and room changes | Room 4 is used differently; specialty changes remain a possible planning factor |
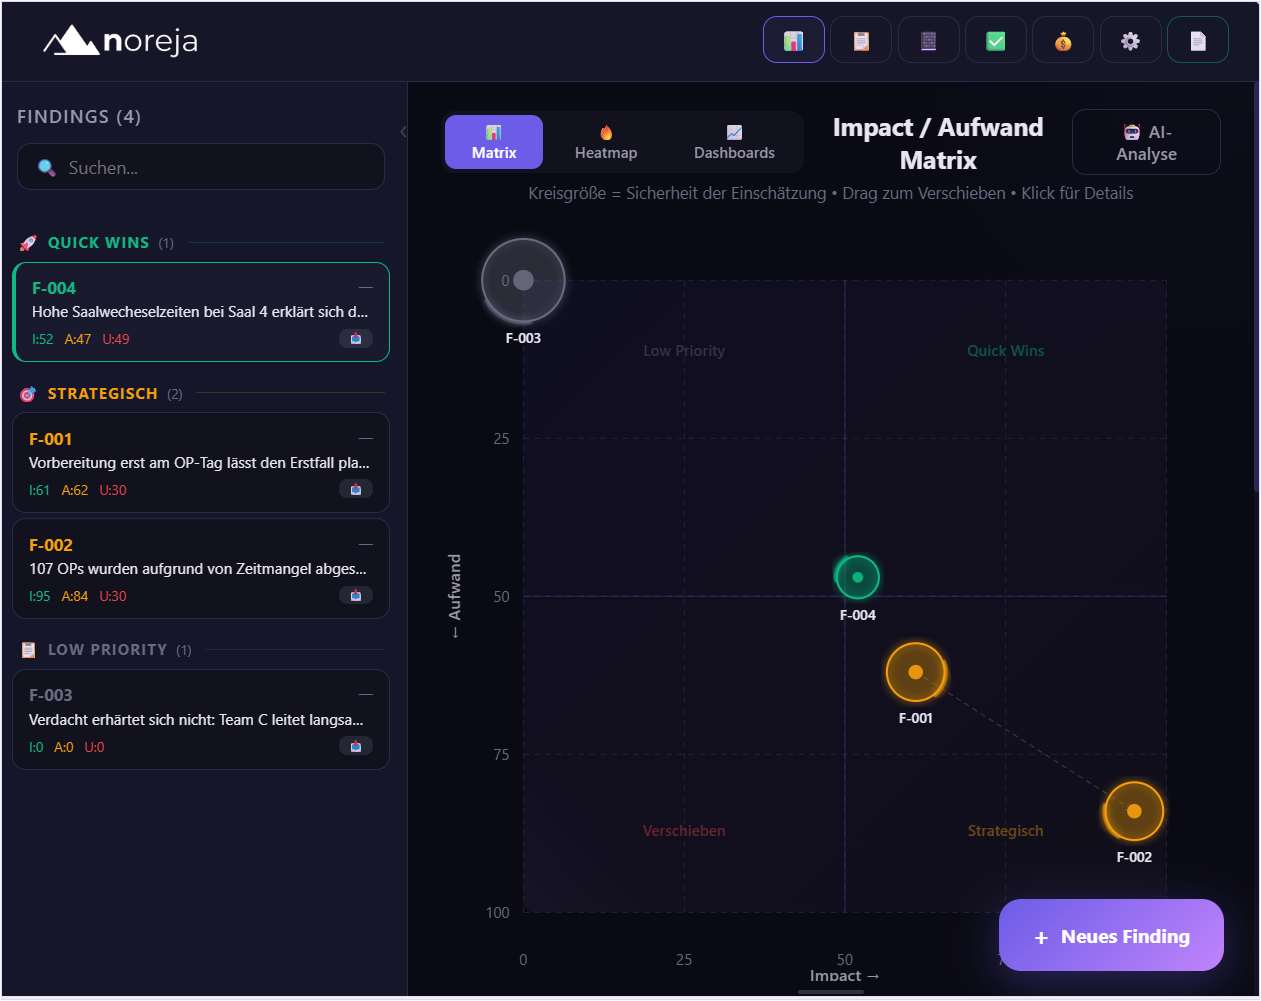
Business Impact Board "From finding to prioritized option for action" – control and decision-making authority remain with the responsible business department at all times, in a traceable way
An identified cause is not yet a measure. Only its business assessment decides where change actually makes sense.
The cycle: Insight → Action → Impact → Feedback
The impact of a prioritized measure is then measured again using the same process data: This creates a closed improvement cycle:
| Step | OR example |
|---|---|
| Insight | Preparation and PACU/bed mechanisms contribute to visible capacity losses in the OR. |
| Action | Stabilize preparation before call-up; address the cause of late bed release notification organizationally. |
| Impact | Measure first-case on-time start (FCOTS), holds, blocked OR capacity, cancellations and end of day again. |
| Feedback | If the implementation does not show the expected impact, the cause hypothesis is reviewed and adjusted. |
The decision remains with the business department. Causal Process Mining provides the relationships and the basis for decisions – which measure is implemented is decided by the organization.
Check the impact after every measure
- Does the punctuality of first operations actually increase?
- Does the number of preparation steps completed late before patient call-up or room entry decrease?
- Are beds reported earlier and more reliably after transfer clearance?
- Do PACU backlogs and OR holds decrease?
- Are fewer subsequent procedures pushed back by delays from preceding cases?
- Do cancellations due to lack of time decrease?
- Does the effect remain stable – or does the bottleneck merely shift to another point between ward, OR, recovery room and bed?
Minerva Frontier Agents can accompany this control loop 24x7: detecting new findings, developing hypotheses further and continuously monitoring the impact of implemented measures.
What Causal Process Mining changes here
Classic process mining shows very well what happens: variants, throughput times, waiting times, repetitions and deviations.
For the why, business logic, context and cross-case relationships are also needed. Causal Process Mining therefore combines observed process data with knowledge about which resources are shared, which states depend on each other from a business perspective and which alternative explanations need to be tested.
The healthcare case shows four things that a pure KPI or single-case analysis easily overlooks:
- Correlation is not automatically causation. Team C, room 4 and PACU staffing show how tempting raw comparisons can be.
- The affected case does not necessarily carry its own cause. The later cancellation may have been set up by preceding cases or other patients.
- Shared resources connect cases. Operating room, PACU bay and ward bed create dependencies across case boundaries.
- Not every finding needs a measure. Some causes are prioritized, others are deliberately investigated further or discarded.
Causal Process Mining in noreja combines process data, business logic and cross-case relationships for this purpose. Minerva makes this knowledge base accessible through specific business questions and reusable analyses. The focus is not on the product – but on the better decision.
Conclusion: understand the cause first, then choose the right measure
The perioperative patient pathway shows why conspicuous metrics alone are not sufficient control logic. Team C seems slower. Room 4 stands out in turnover times. Reduced PACU staffing correlates with more holds.
Anyone who derives measures from this immediately may only be optimizing the most visible symptom.
Causal Process Mining therefore does not start with the largest possible process map and does not end with a conspicuous metric. It connects process data, business relationships, shared resources and cross-case dependencies.
In the healthcare example shown, this changes the perspective significantly: preparation completed late can destabilize the start of the day. Ward beds reported late or in batches can tie up PACU bays longer and carry the backlog into the OR. Delays can also propagate from procedure to procedure via preceding cases and shared resources.
"Optimizing the OR" thus becomes a more concrete task: stabilize preparation, consider bed and PACU processes together, understand cross-case cascades – and then measure whether the chosen measures actually create more stability and capacity.
Don't just see where the delay occurs. Understand where it arises. Prioritize causes. Measure impact.