
Lead-To-Activation (District Heating Connection)
Note on the demo: The metrics shown in this article come from a synthetic demonstration dataset. They serve to illustrate analysis paths and methodological relationships and are not the production metrics of any customer.
When you describe a district heating connection from the customer's perspective, the process sounds simple at first: interest, quote, contract, construction, connection and finally heat supply.
In reality, the process is considerably more complex. Even before the order, information resides in different systems and objects. After the order, the process branches into several parallel strands: civil engineering or external services, material procurement, house connection and commercial prerequisites. Later these strands have to be brought back together before construction, commissioning, billing and start of supply become possible.
It is precisely in such processes that a limitation of classic process mining representations becomes apparent: a single process map does not answer every business question. It becomes even more problematic when the process reality is reduced to a single case ID and a flat event log as early as the data import stage.
The central question is therefore not only: How do we visualize the process?
But rather: How do we preserve the relationships and the granularity of the real process – and reduce complexity only when we want to answer a concrete business question?
1. The common foundation: an Event Knowledge Graph
In the demonstration model, sales information, order, order items, project structures, civil engineering, material procurement, deliveries, invoices and payments, construction activities, the plant/asset, meter installation, commissioning, the heat supply contract and handover protocols are all linked together.
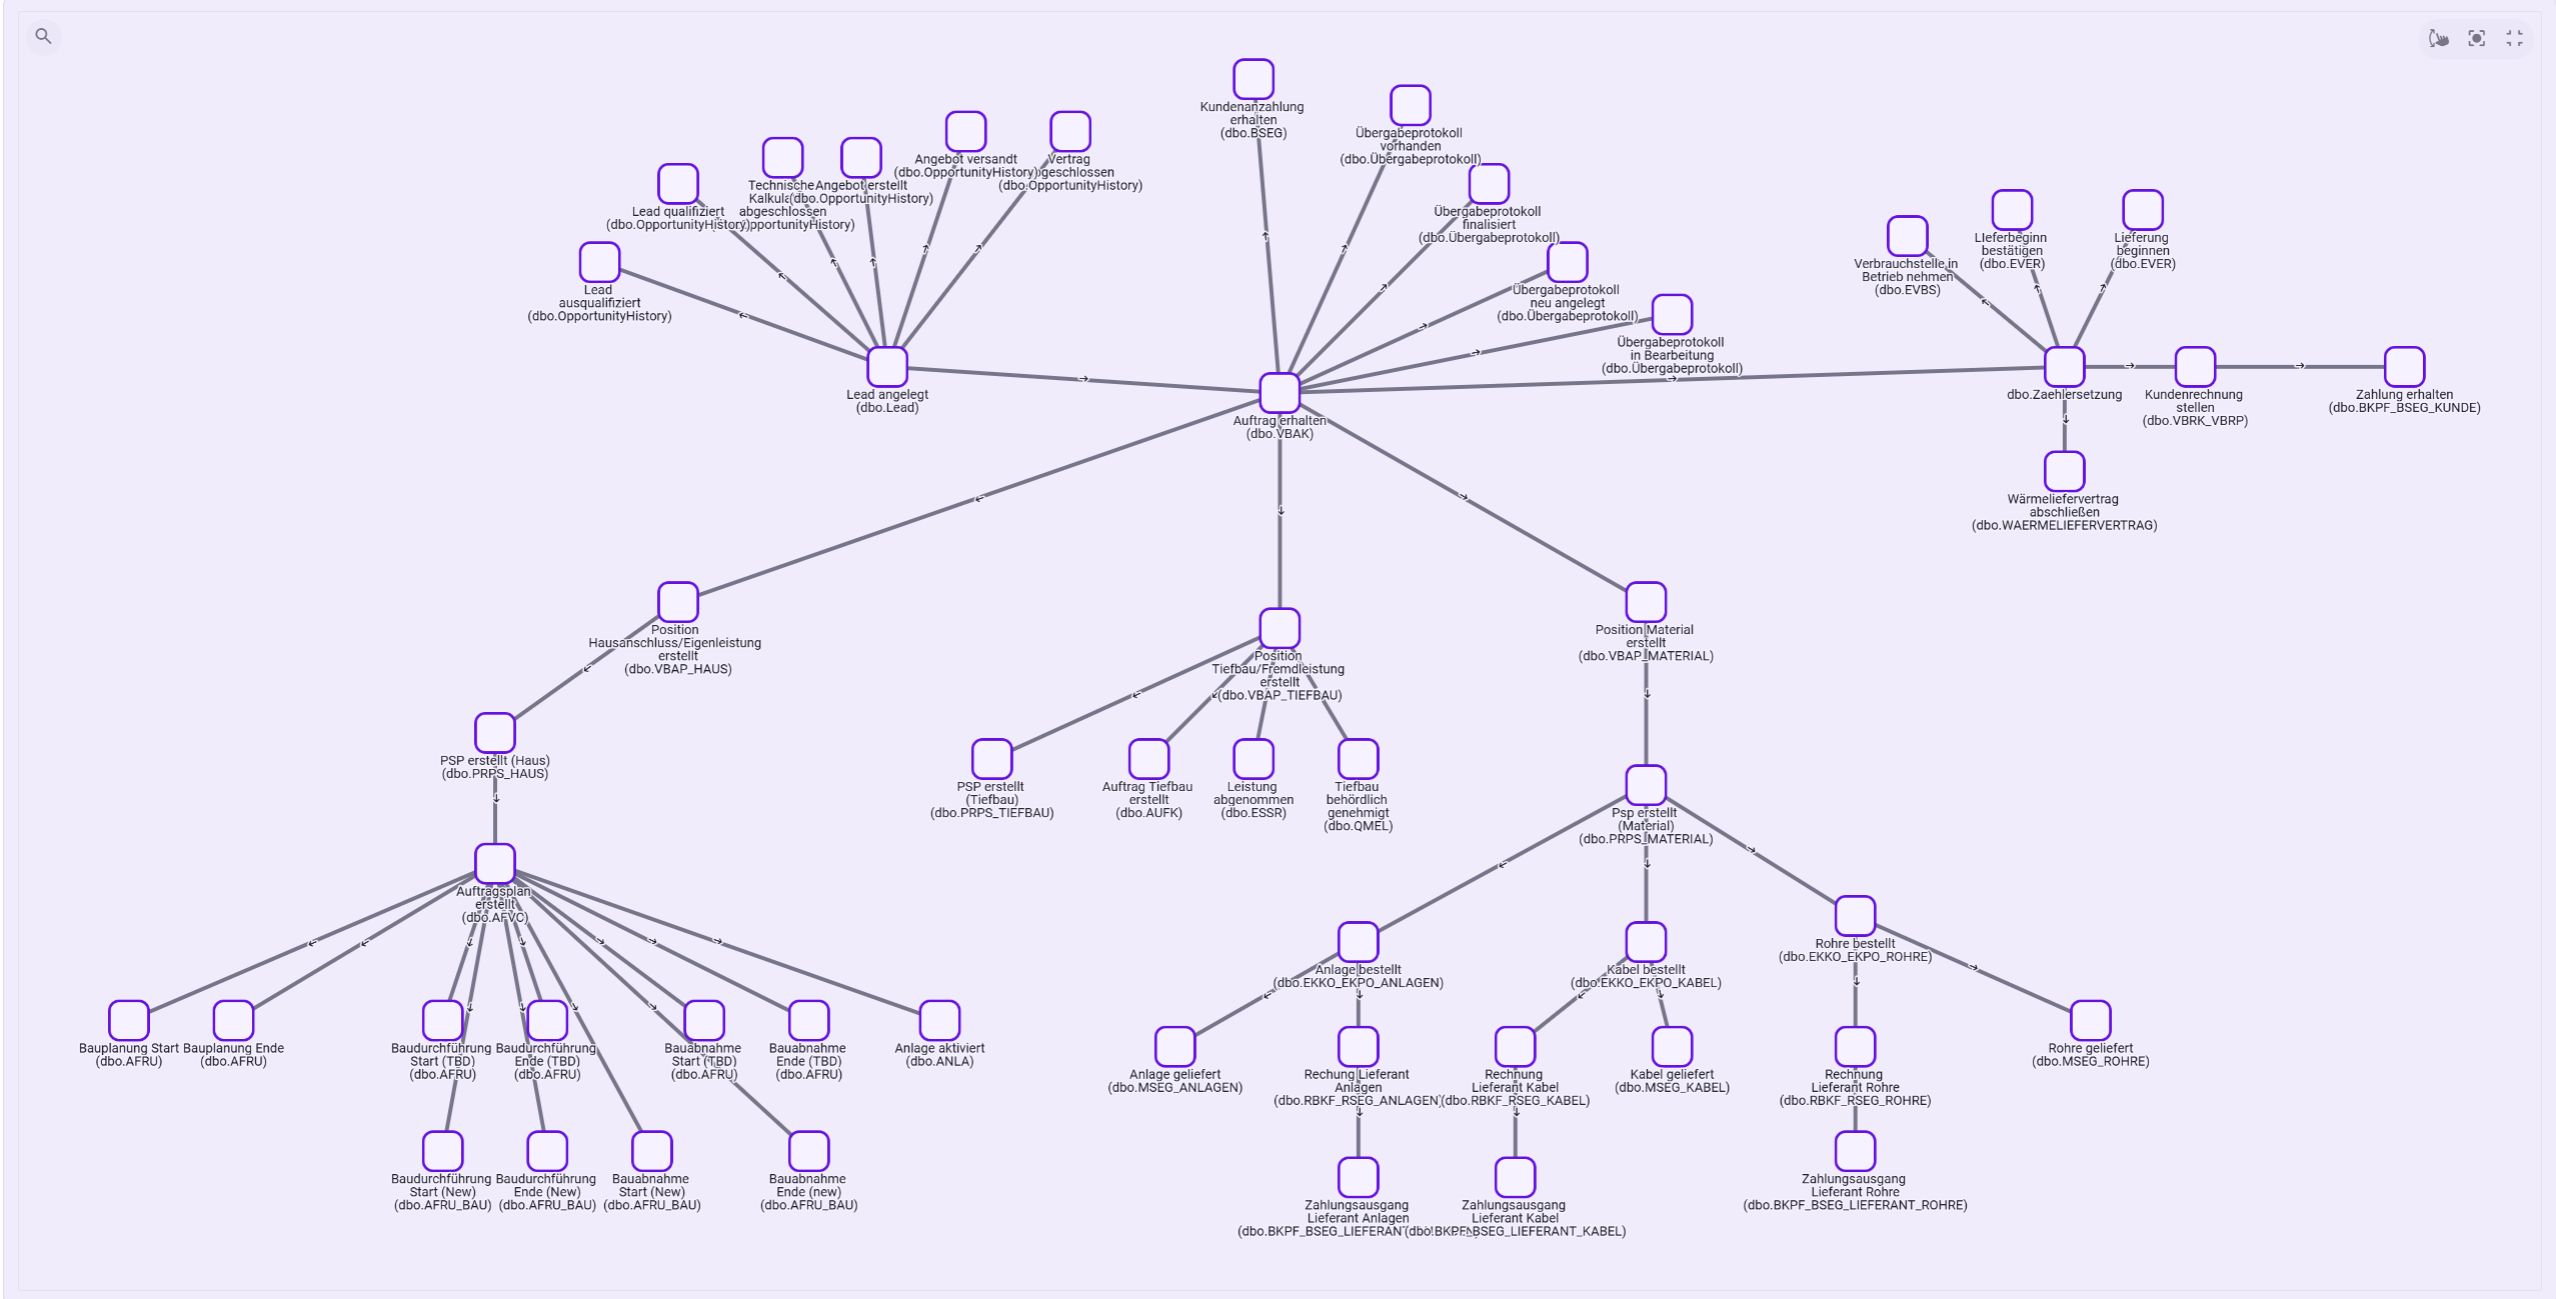
The decisive point is not the visualization of the graph itself. What matters is that the relationships between the business objects are preserved.
Depending on the question, the relevant business unit may in fact be a different one: a lead, an order, a WBS element, a purchase order, a construction activity, a plant/asset or a handover protocol.
Noreja therefore does not reduce the process to a single case ID as early as the data import. The relationships between the objects are preserved and can later be interpreted differently depending on the process question.
This leads to a simple basic principle:
Complexity is reduced during analysis – not already at data import.
2. Perspectives: different business questions on the same process knowledge
Different perspectives can be formed from the same Event Knowledge Graph. A perspective is not simply a different filter. It describes a business hypothesis about which activities, states and dependencies are relevant for a particular question.
Sales: from lead to order
For sales, neither material procurement nor civil engineering nor commissioning are of initial interest. What is relevant is the commercial stretch from lead through qualification and technical calculation to quote, contract and order.
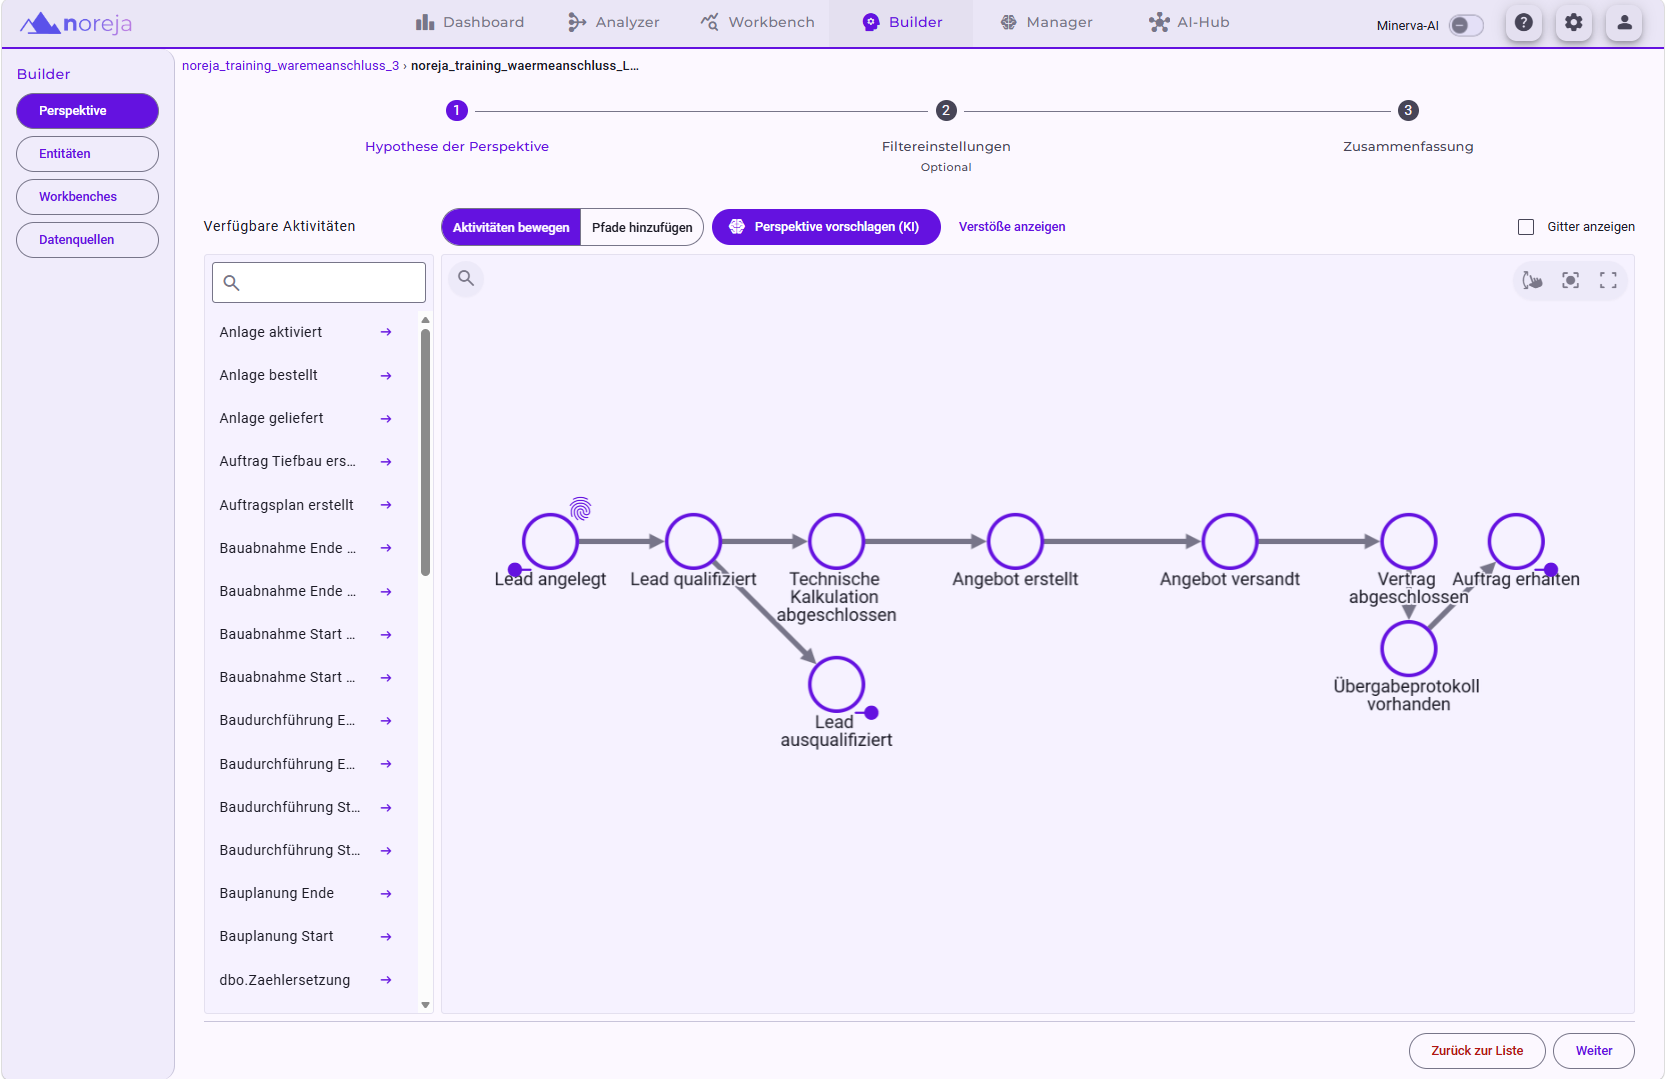
This allows questions such as the following to be examined:
- Where do we lose leads?
- Where does rework arise in the quotation process?
- How long does the technical calculation take up to the quote?
- Which deviations are genuine error patterns and which are merely permissible variants?
Trade coordination: which prerequisites must be met jointly?
For construction and project management, a different view is necessary.
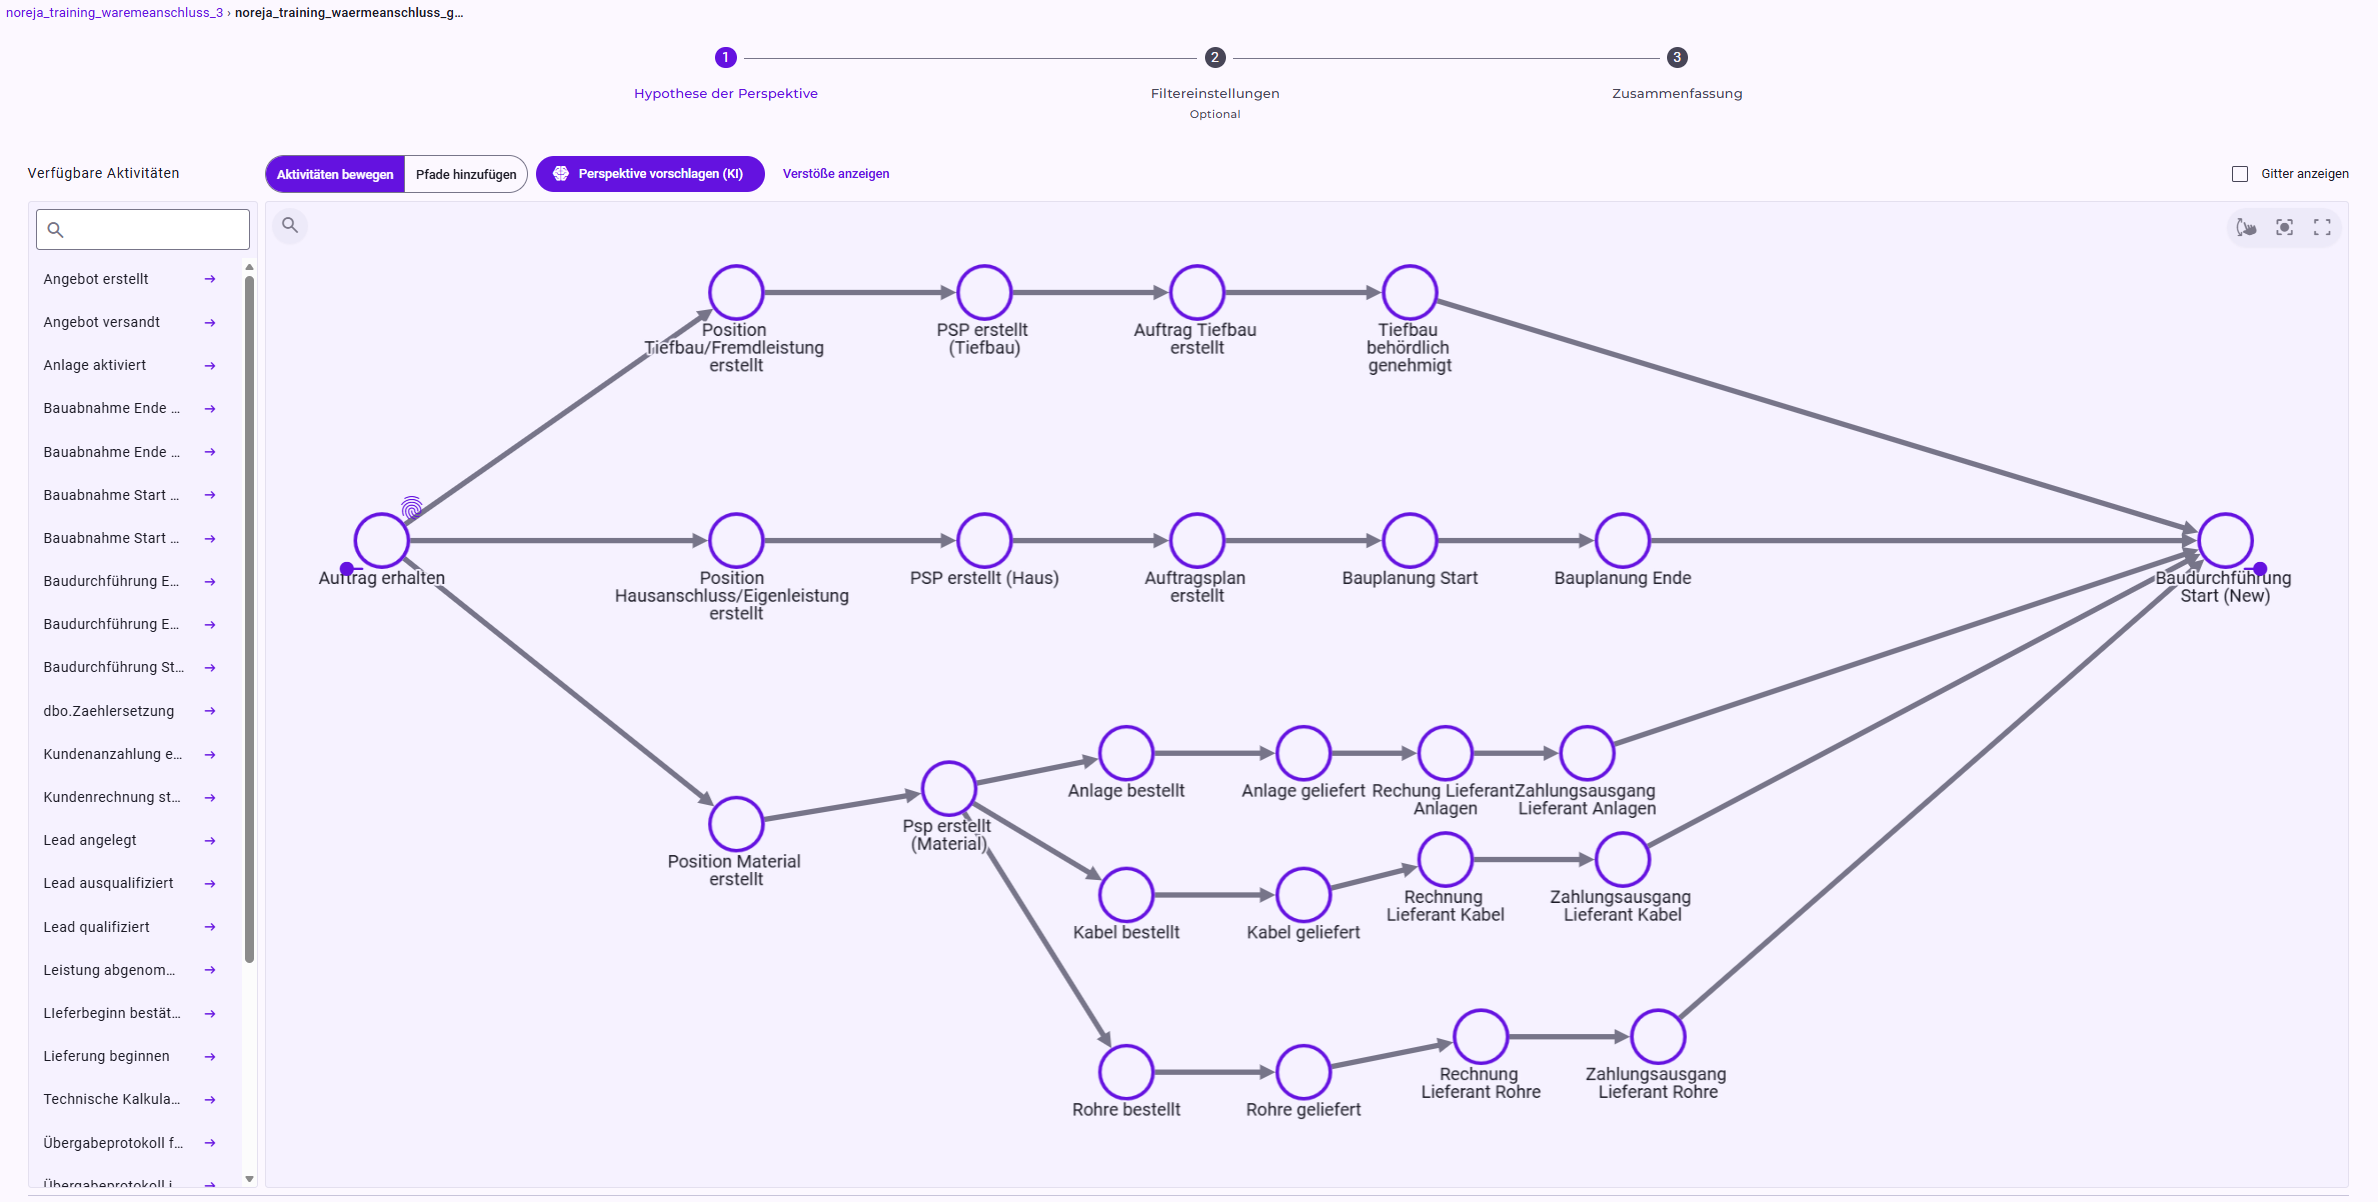
Here the question is which prerequisites must be met before construction execution can begin. Civil engineering, house connection and different material strands run in parallel and converge into a common subsequent step.
Handover protocol: process states instead of just timestamps
For the handover, a strongly reduced view is in turn appropriate.
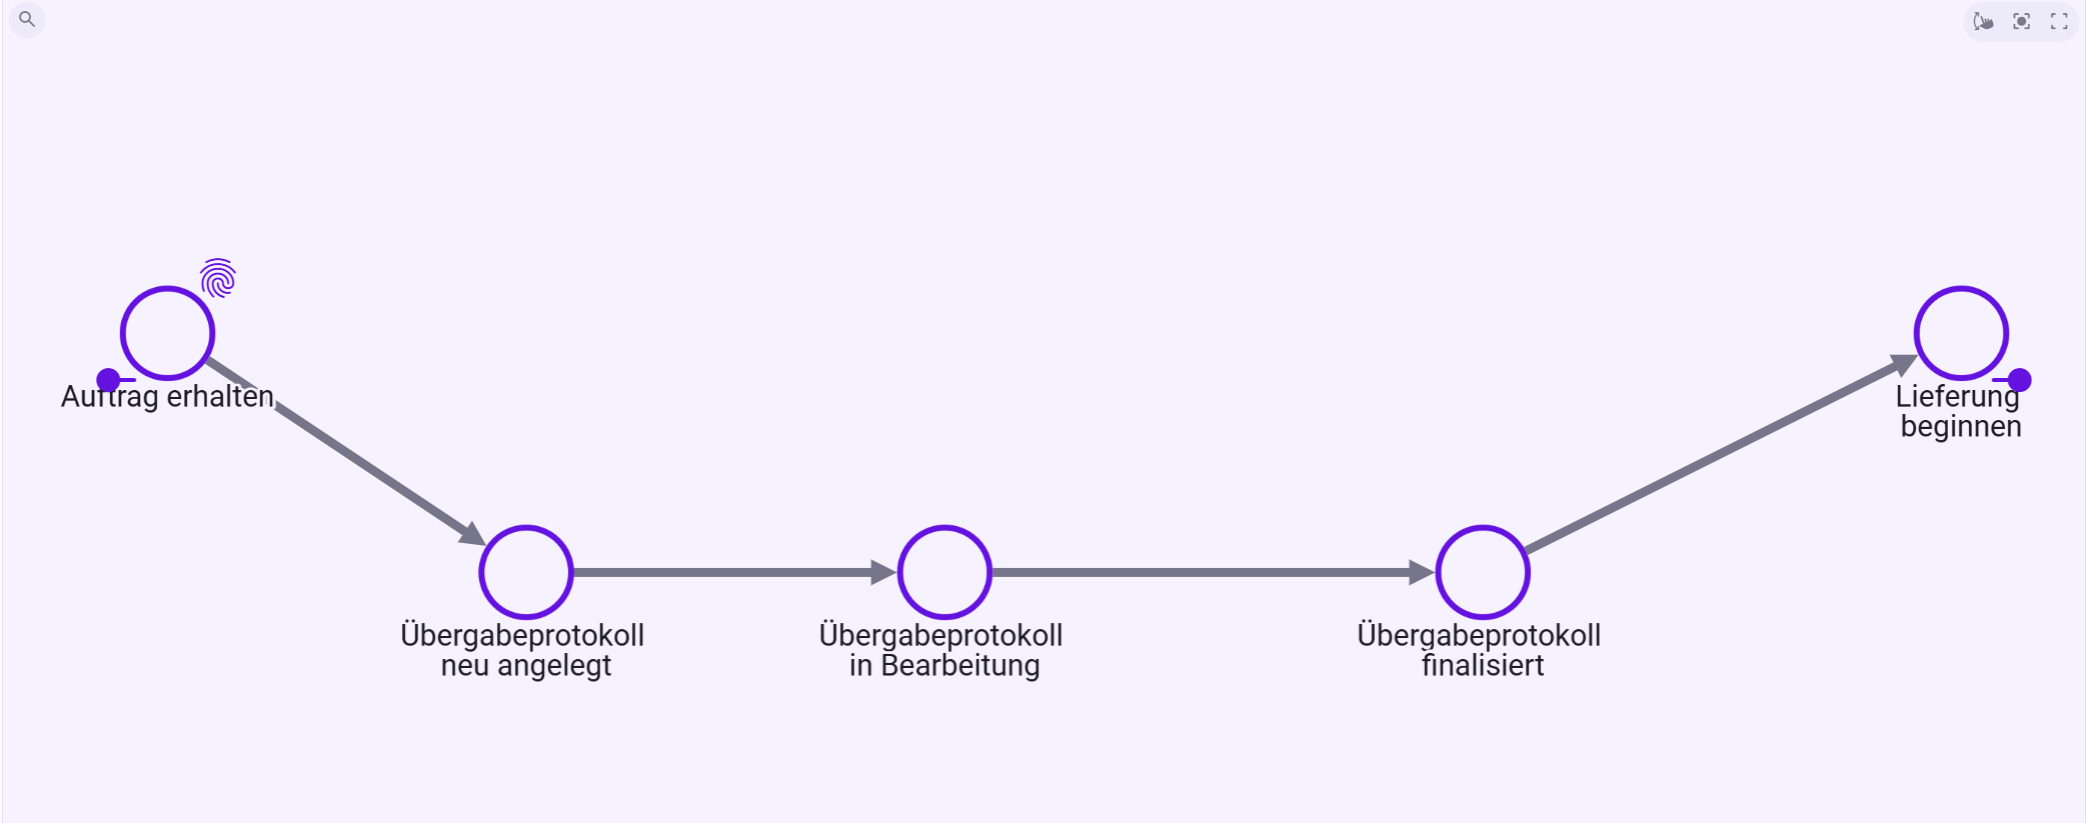
The relevant question here is: Which states of the handover protocol must be reached before delivery may begin?
End-to-end: from lead to start of supply
For management or end-to-end questions, a broader perspective is needed again.
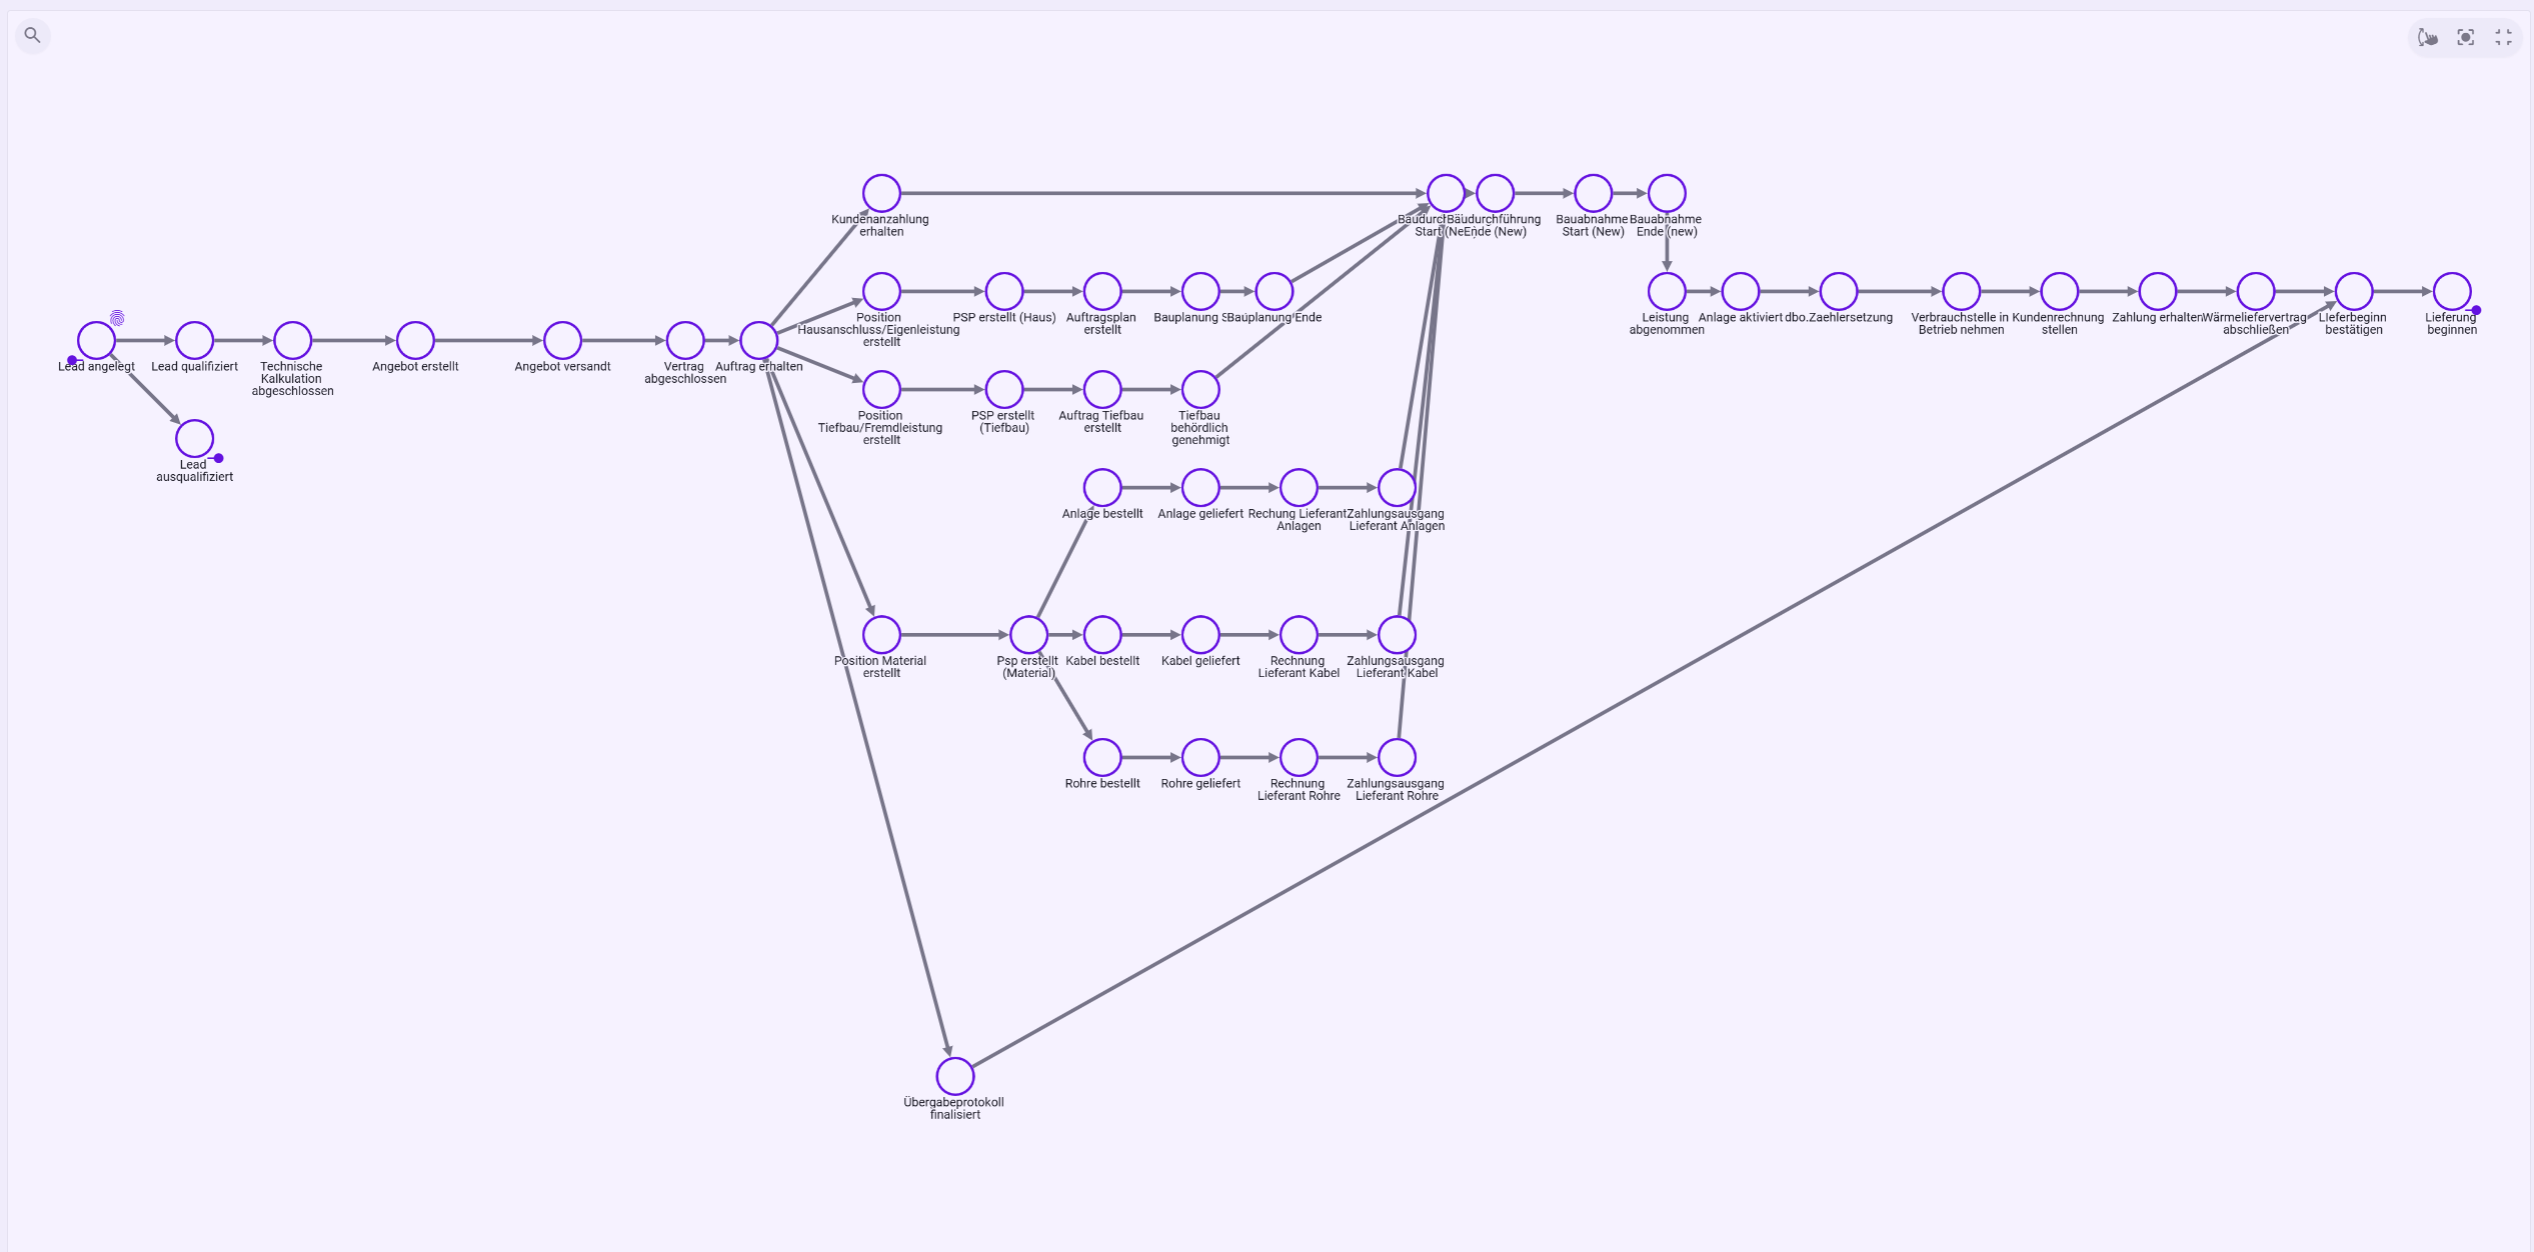
This makes it clear: the different perspectives all draw on the same process knowledge. They merely reduce the complexity to the respective business question.
The Event Knowledge Graph preserves the granularity and relationships of the real process; perspectives then reduce this complexity to the concrete business question.
3. The process reality: from the overall picture down to the individual ERP object
The end-to-end perspective initially shows the big picture of the district heating connection.

At this level you can examine transition times between activities, start and end times, change times and states. It becomes interesting, however, only when an anomaly becomes visible and the user wants to dig deeper.
One example is the procurement of technical equipment.
Detail view of the procurement strand at the activity "Equipment ordered"
In the demonstration dataset, a total of 1,758 procurement objects are visible at the activity "Equipment ordered". 550 of them are not carried through to the subsequent delivery in the process view shown.
The number does not remain, however, as an abstract metric. A click on the activity leads directly to the underlying object data.
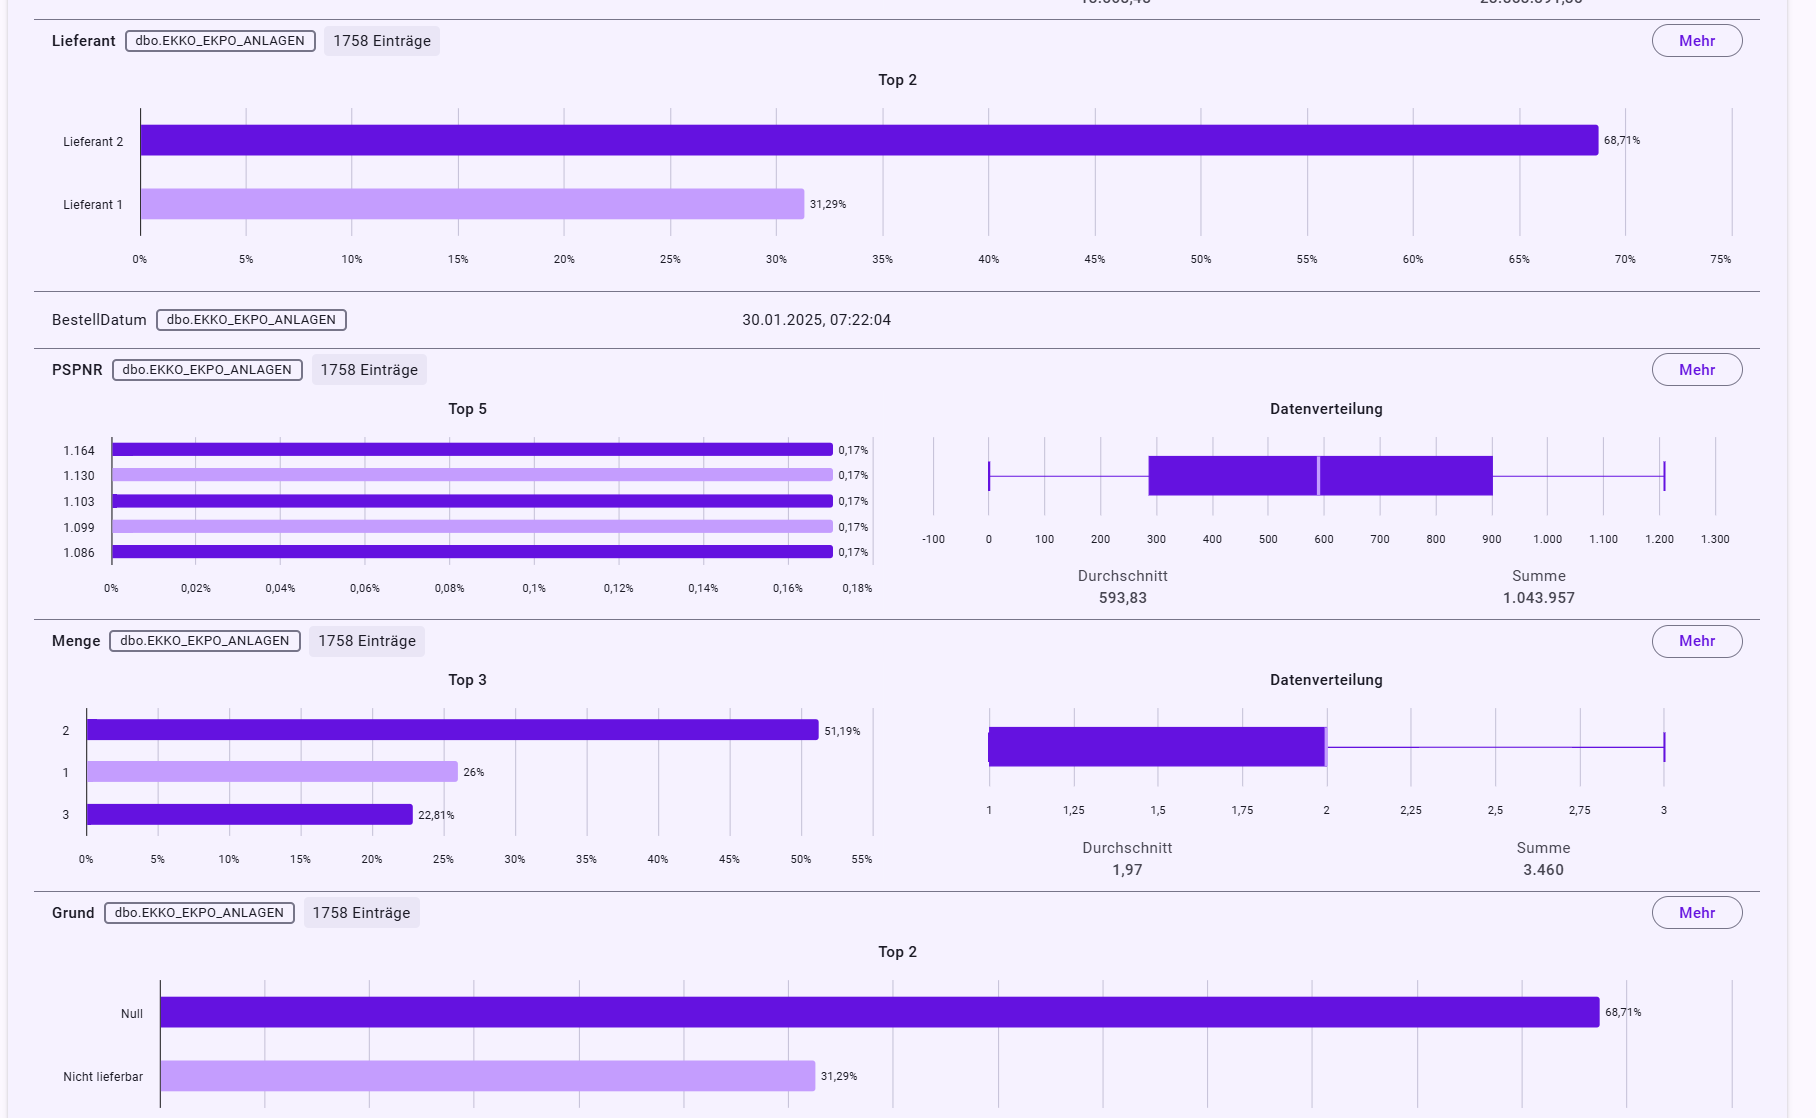
There, among other things, supplier, order date, WBS element, quantity and reason can be analyzed. In the synthetic demo it is modeled that some of the procurement objects end with a first supplier for the reason "Not deliverable" and that the successful path continues via a different supplier.
The user can then drill down to the individual business case.
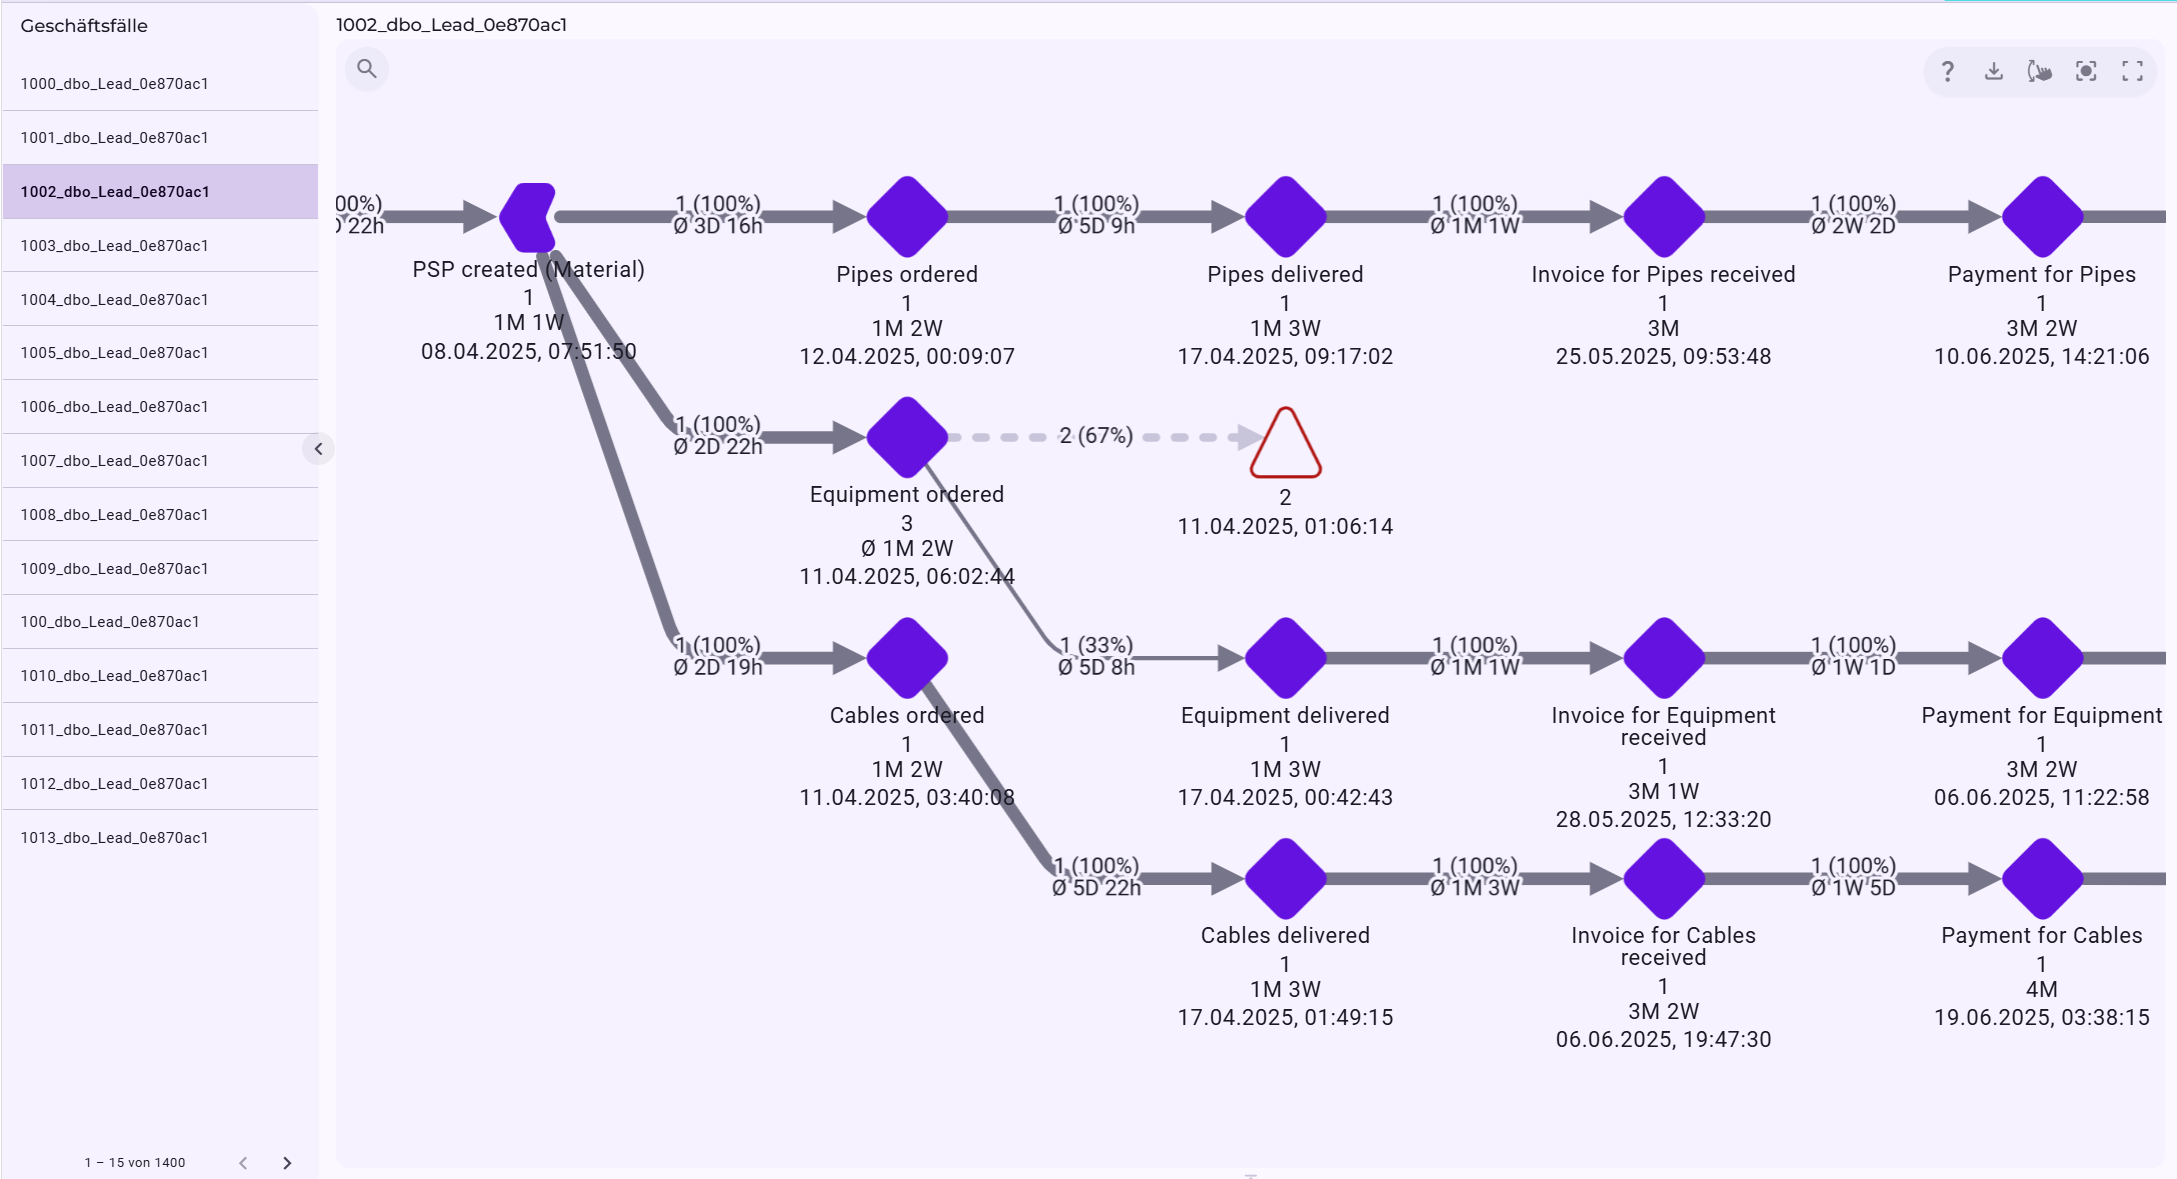
At this level it becomes visible how different procurement objects relate to one another within the same business case. Individual ordering attempts can fail, while a later ordering path successfully continues through to delivery and payment.
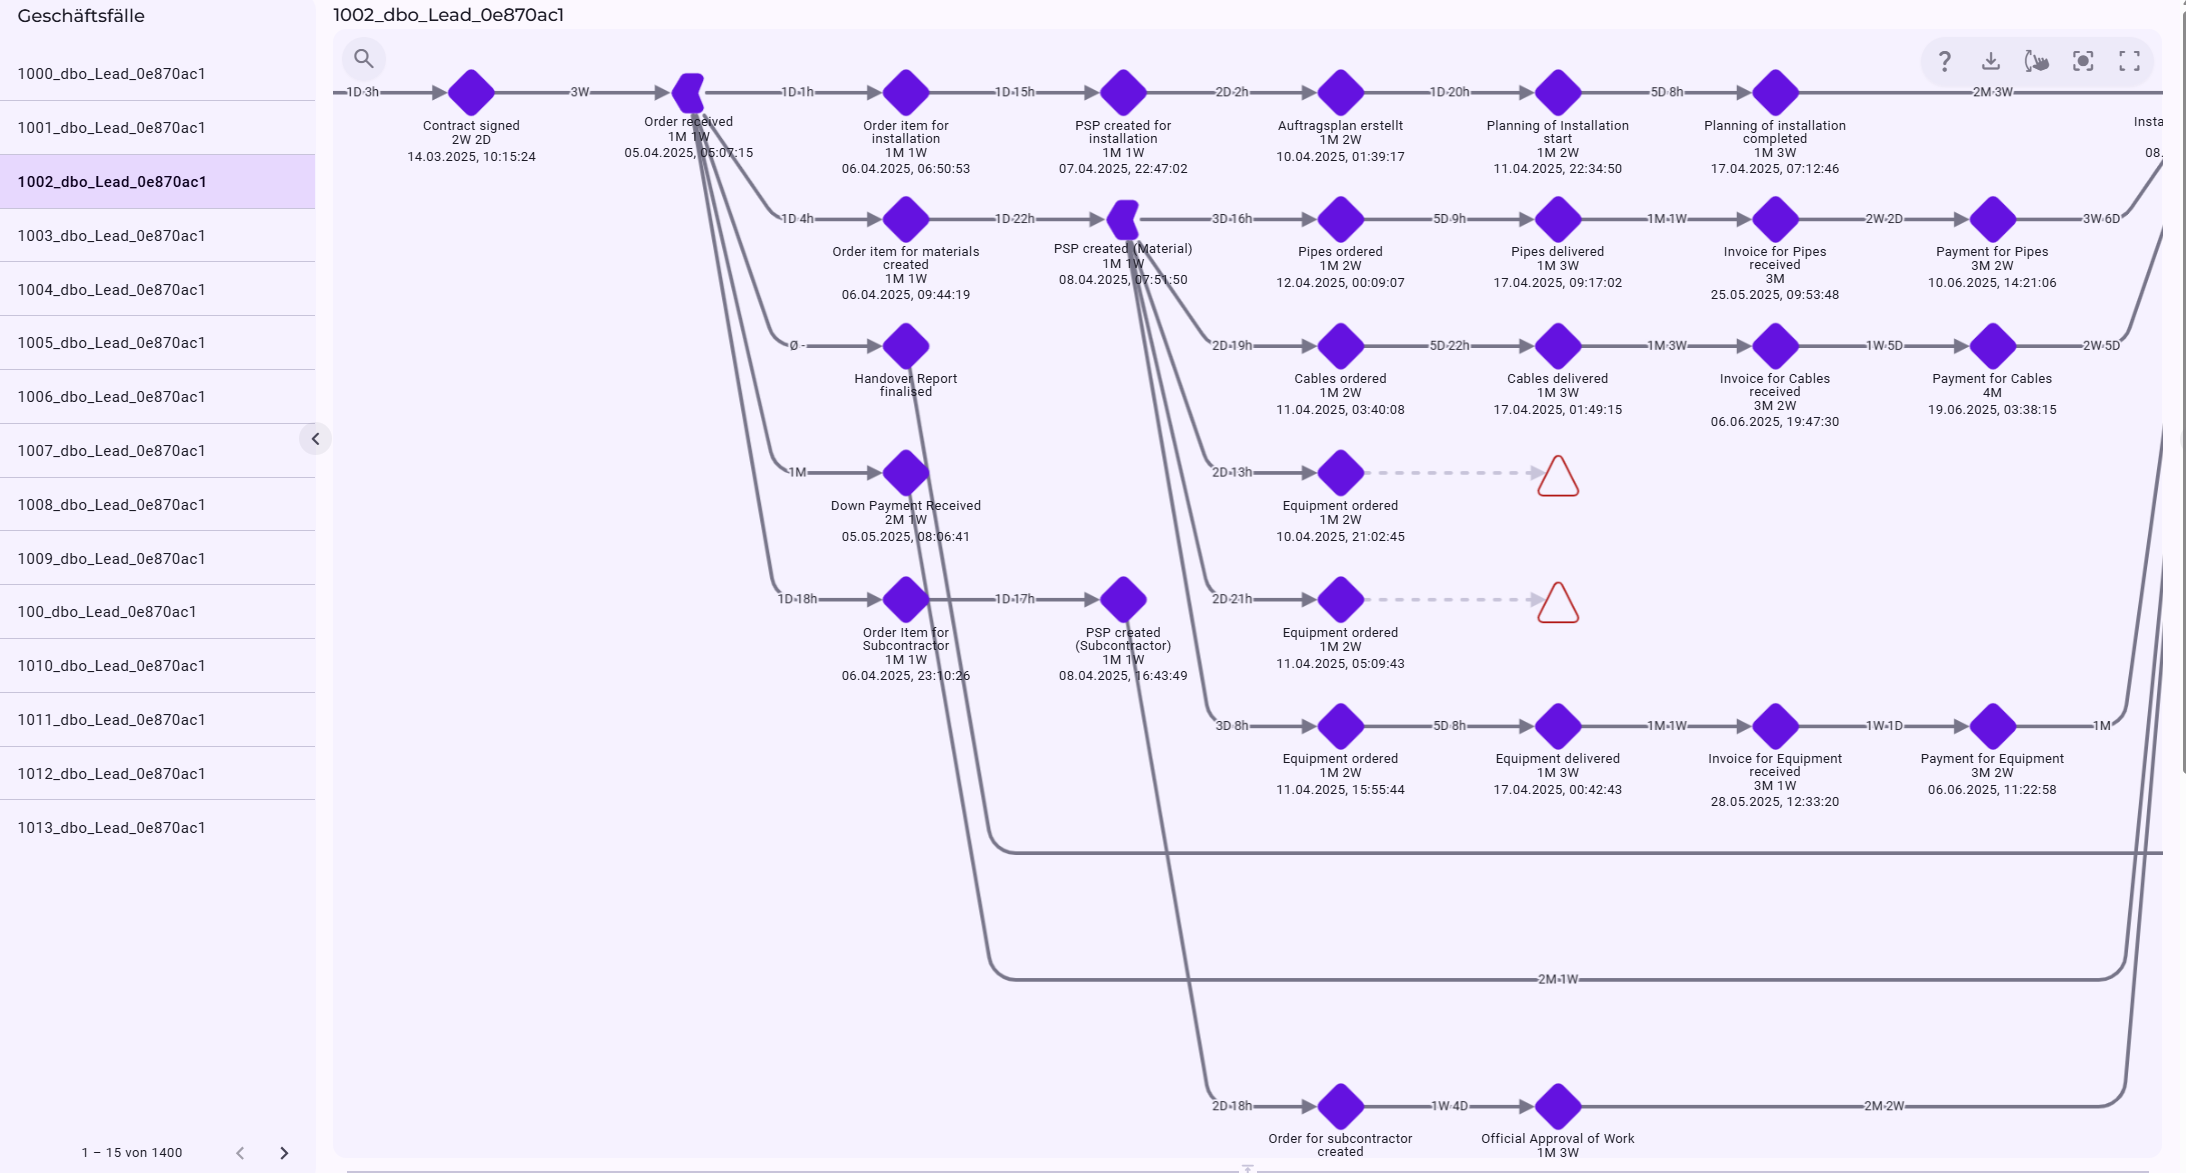
In this way, an anomaly can be traced back from the overall process through the affected process section down to the concrete objects and their relationships.
A metric is thus not the end of the analysis. From the process picture, the process manager can go back to the affected ERP objects, their attributes and their relationships.
4. Error patterns instead of variant explosion
A process analysis quickly becomes confusing when every deviation is automatically treated as a new variant. For a process owner, however, it is less decisive whether an execution is formally variant 127 or variant 342.
The more interesting business question is:
Which recurring error pattern lies behind these executions?
One example is rework in the quotation process.

Between the creation and the sending of a quote, the demo shows 154 rework instances across 1,208 cases examined. That corresponds to around 13 percent and matches the rework logic modeled in the synthetic dataset.
Noreja does not simply treat this repetition as a new process variant, but interprets it in business terms as rework.
The same principle appears later in the process in billing.
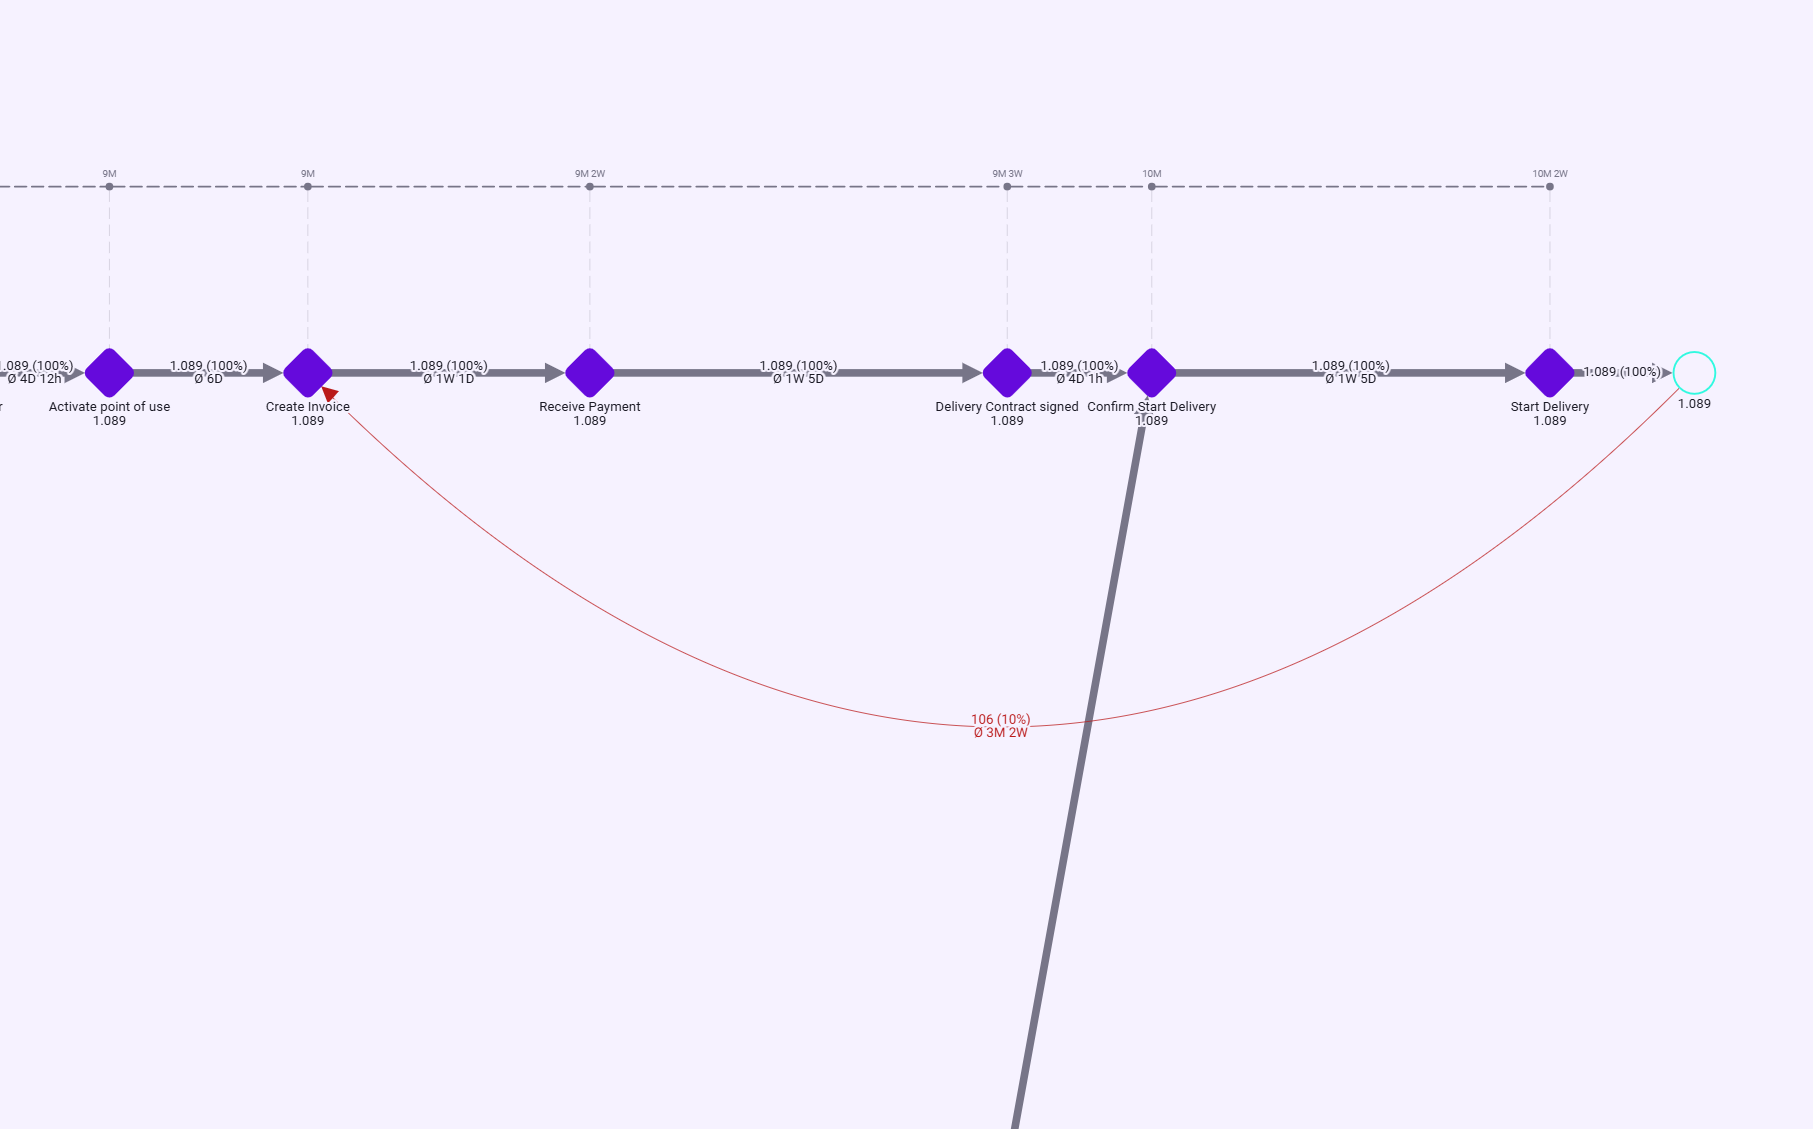
Here, in 106 of 1,089 cases, a later change or rework is visible. The demonstration dataset also contains its own rework pattern for this.
In this way, different deviations can be translated into business-comprehensible categories, for example:
- abort,
- rework,
- ignore or skip,
- ordering/sequence error,
- bundling.
The advantage lies not only in a clearer representation. The analytical question changes:
No longer: "Which variant is this?"
But: "Which error pattern is present, why does it arise and what impact does it have?"
5. From the single delay to the recurring time pattern
A long lead time in an individual business case says little about whether a structural problem exists.
The same activity can therefore first be examined across all affected process instances.
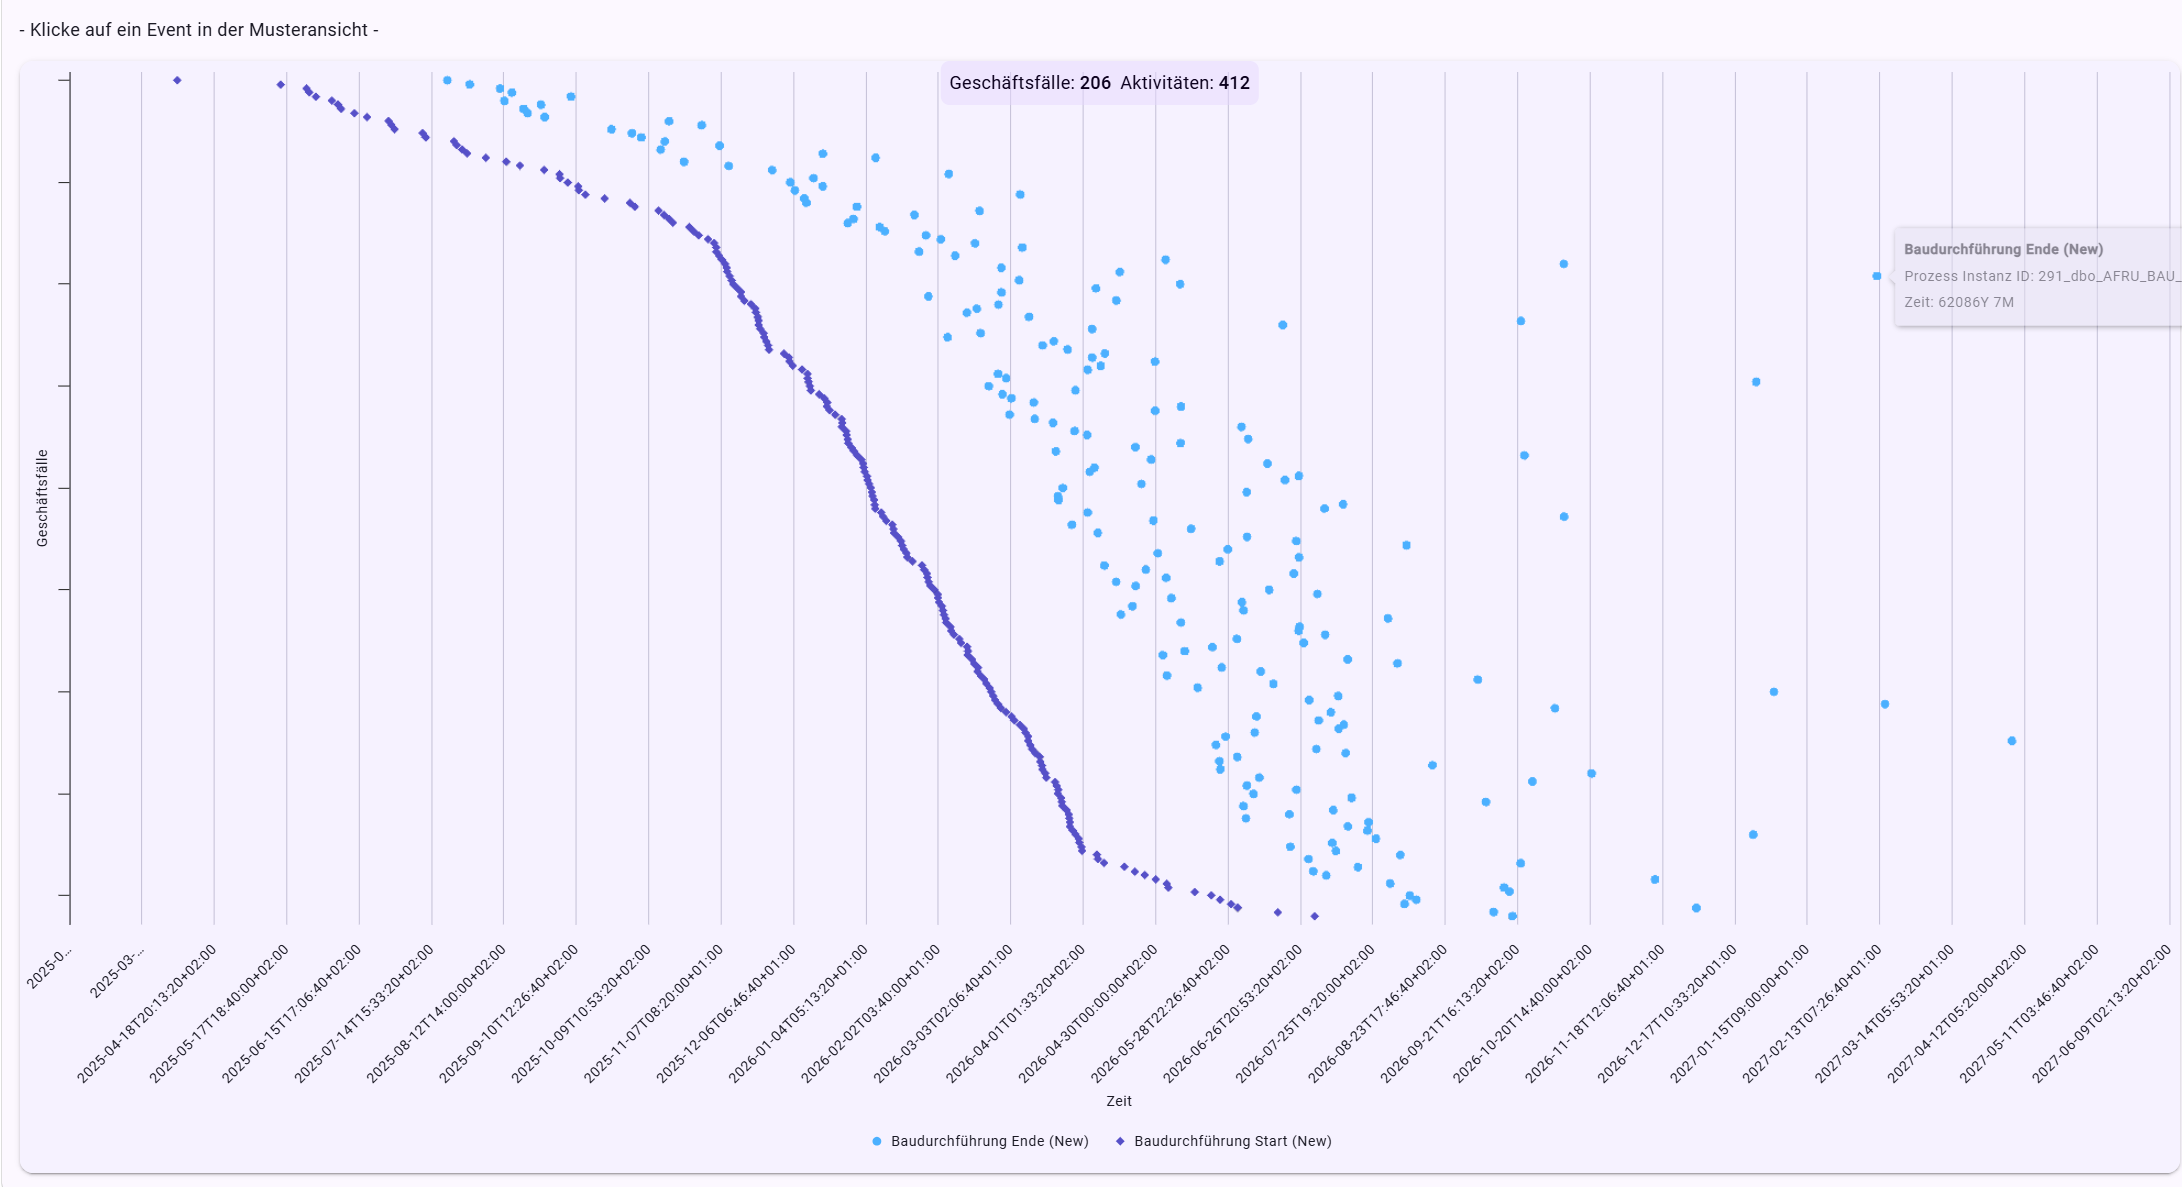
In this example, we look at the start and end of construction execution. Each point remains assignable to a concrete business case.
The next question is:
Are long construction times individual outliers or a recurring pattern?
For this, a time series can be generated from the same process data.
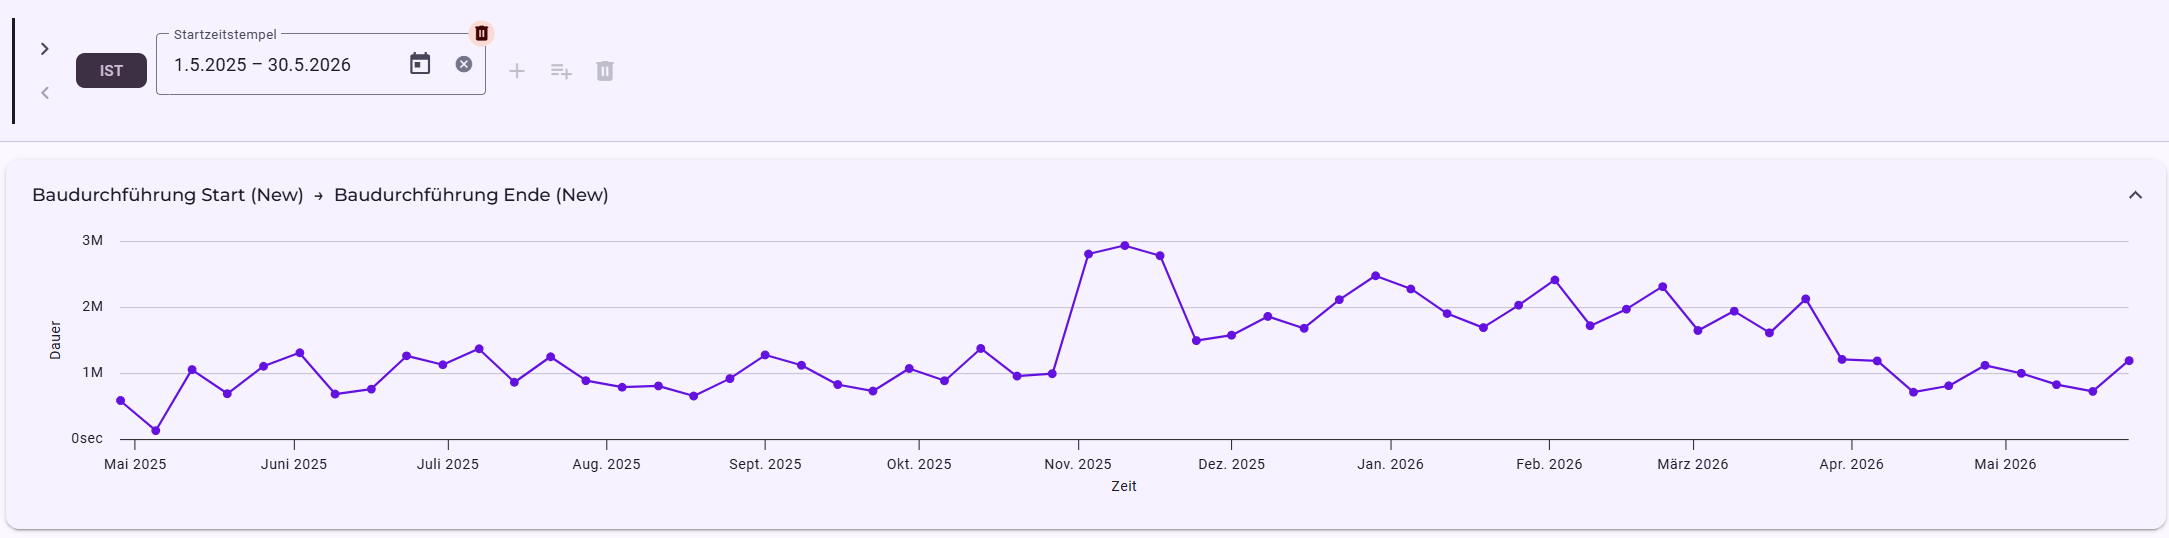
In the synthetic dataset, a clear seasonal pattern becomes visible. While construction execution is predominantly shorter in the warmer months, the duration rises significantly from November and remains elevated throughout the winter months. From April onward it declines again.
The benefit lies less in the concrete demo figure than in the analysis path:
Not only: "Is our overall process slower in winter?"
But:
"Which concrete part of the process becomes slower, when does the effect begin, how strong is it and does it repeat?"
In this way, even a time series remains connected to the process structure and can again be traced back to concrete periods, cases and objects.
6. Causal process logic: not only when, but why
The analysis so far shows what happens in the process. For process improvement, however, transparency is not enough. What is decisive is the explanation.
Example: handover protocol
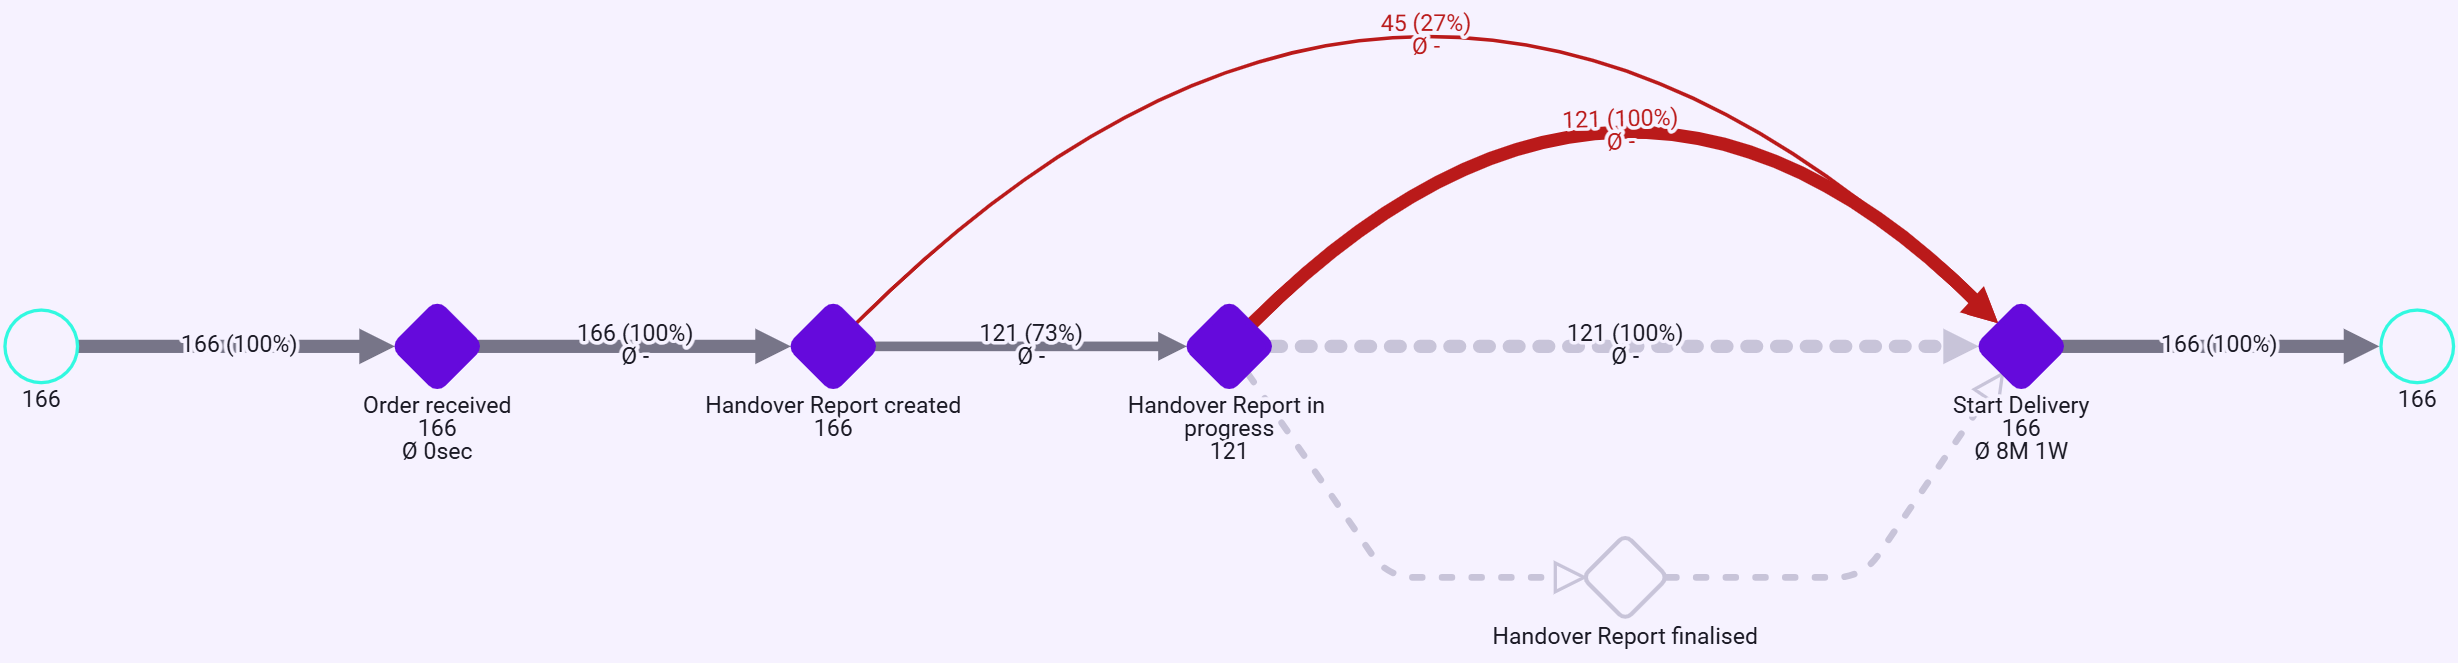
In the perspective shown, we look at business processes in which a handover protocol was created. Some of them do not subsequently reach all the states expected in business terms before the start of supply occurs.
This makes the following question more important than the mere sequence of events:
Were all business prerequisites met at the time supply began?
In the process knowledge, it can be stored which states are required before a subsequent step is permissible in business terms. This makes it possible to distinguish between regular flow, skip, sequence error and possibly merely delayed digital documentation.
Particularly in on-site processes, this distinction is important. A delayed timestamp in the ERP system does not necessarily mean that the real process also took place late. Missing connectivity or a later synchronization can produce the same visible symptom.
This leads to an important insight:
A process error and a data error can look identical in the event log – but require completely different measures.
7. Parallel trades: the next step depends on several prerequisites
After the order, the actual complexity becomes especially visible.
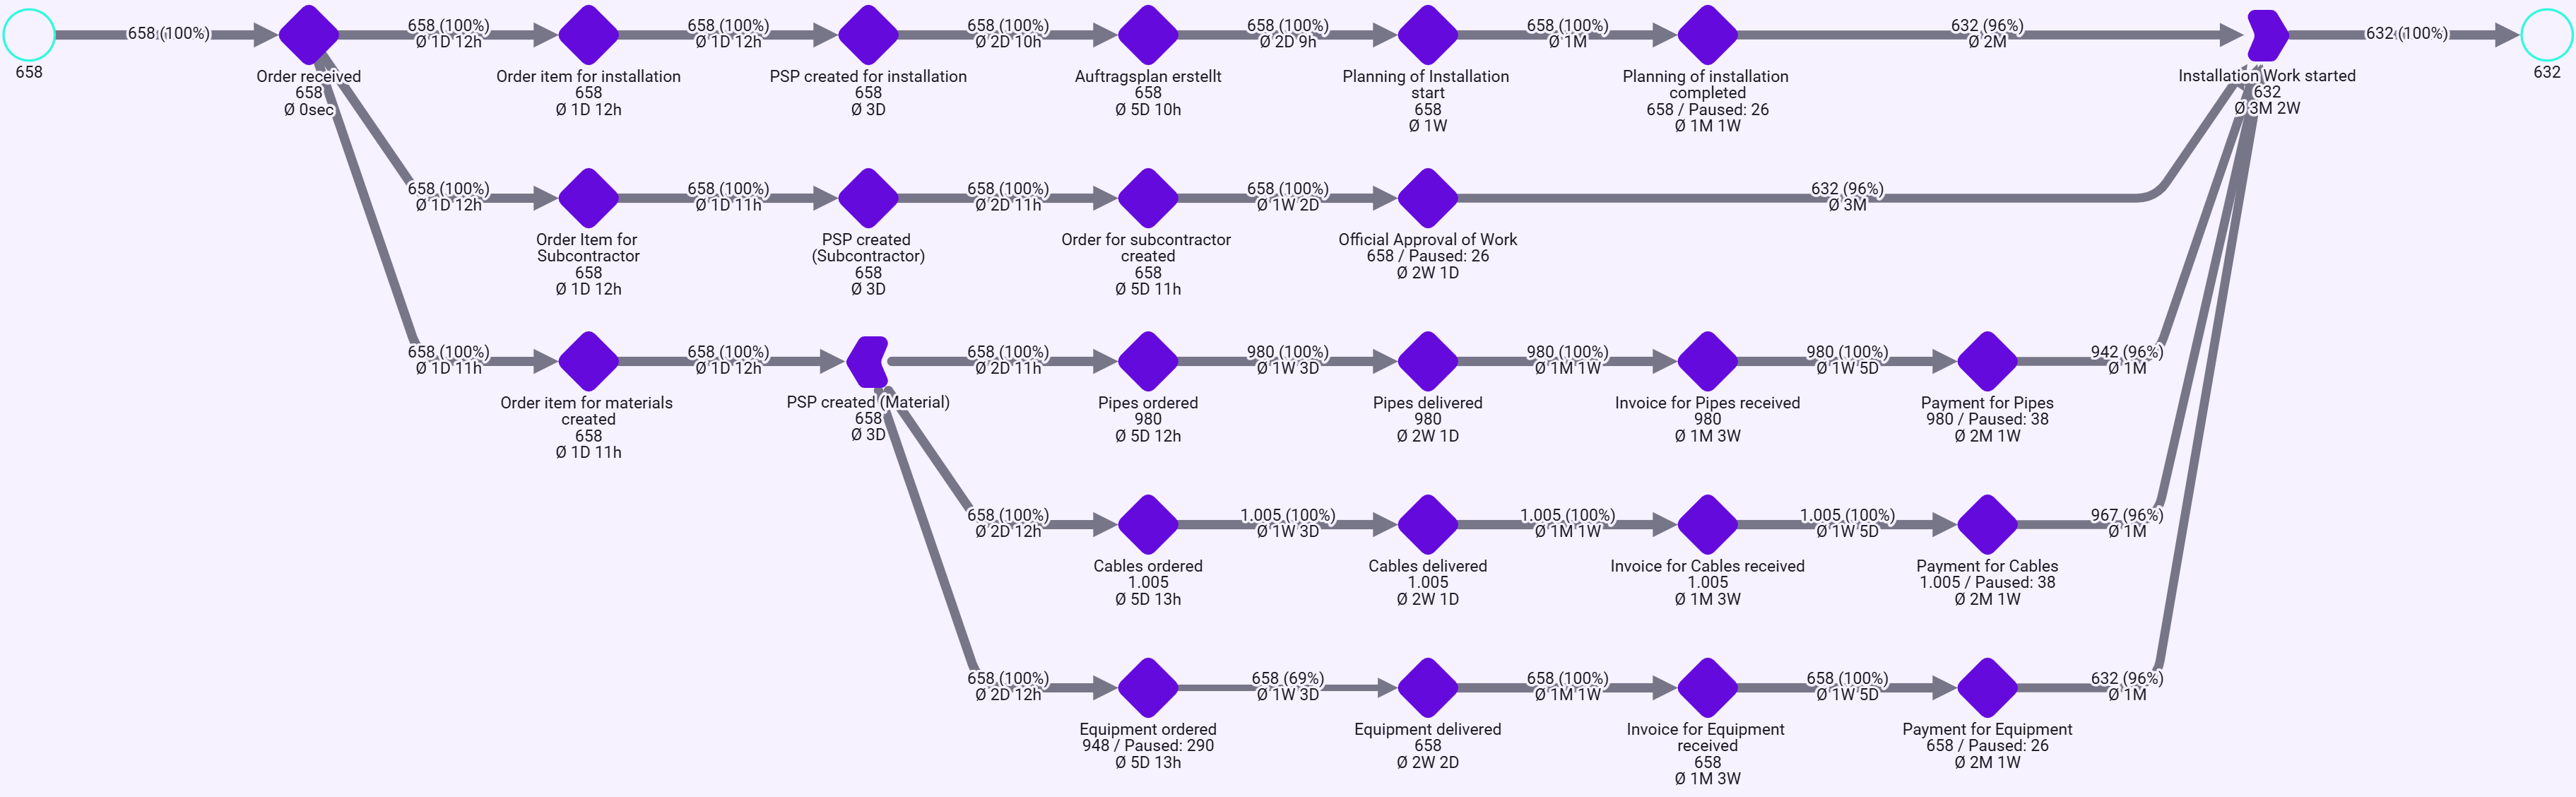
Several strands run in parallel: house connection and construction planning, external services as well as material procurement for pipes, cables and technical equipment.
The subprocesses have different runtimes, objects and cardinalities. A single district heating connection can generate several purchase orders, deliveries or invoices. A business case is therefore not the same as an individual business object.
The common construction start becomes the business synchronization point:
It is not a single activity that determines when construction can take place. Several prerequisites must be met jointly.
This also changes the classic bottleneck question.
Not: "Which activity takes the longest?"
But:
"Which prerequisite is holding back the common next step?"
Filtered case group
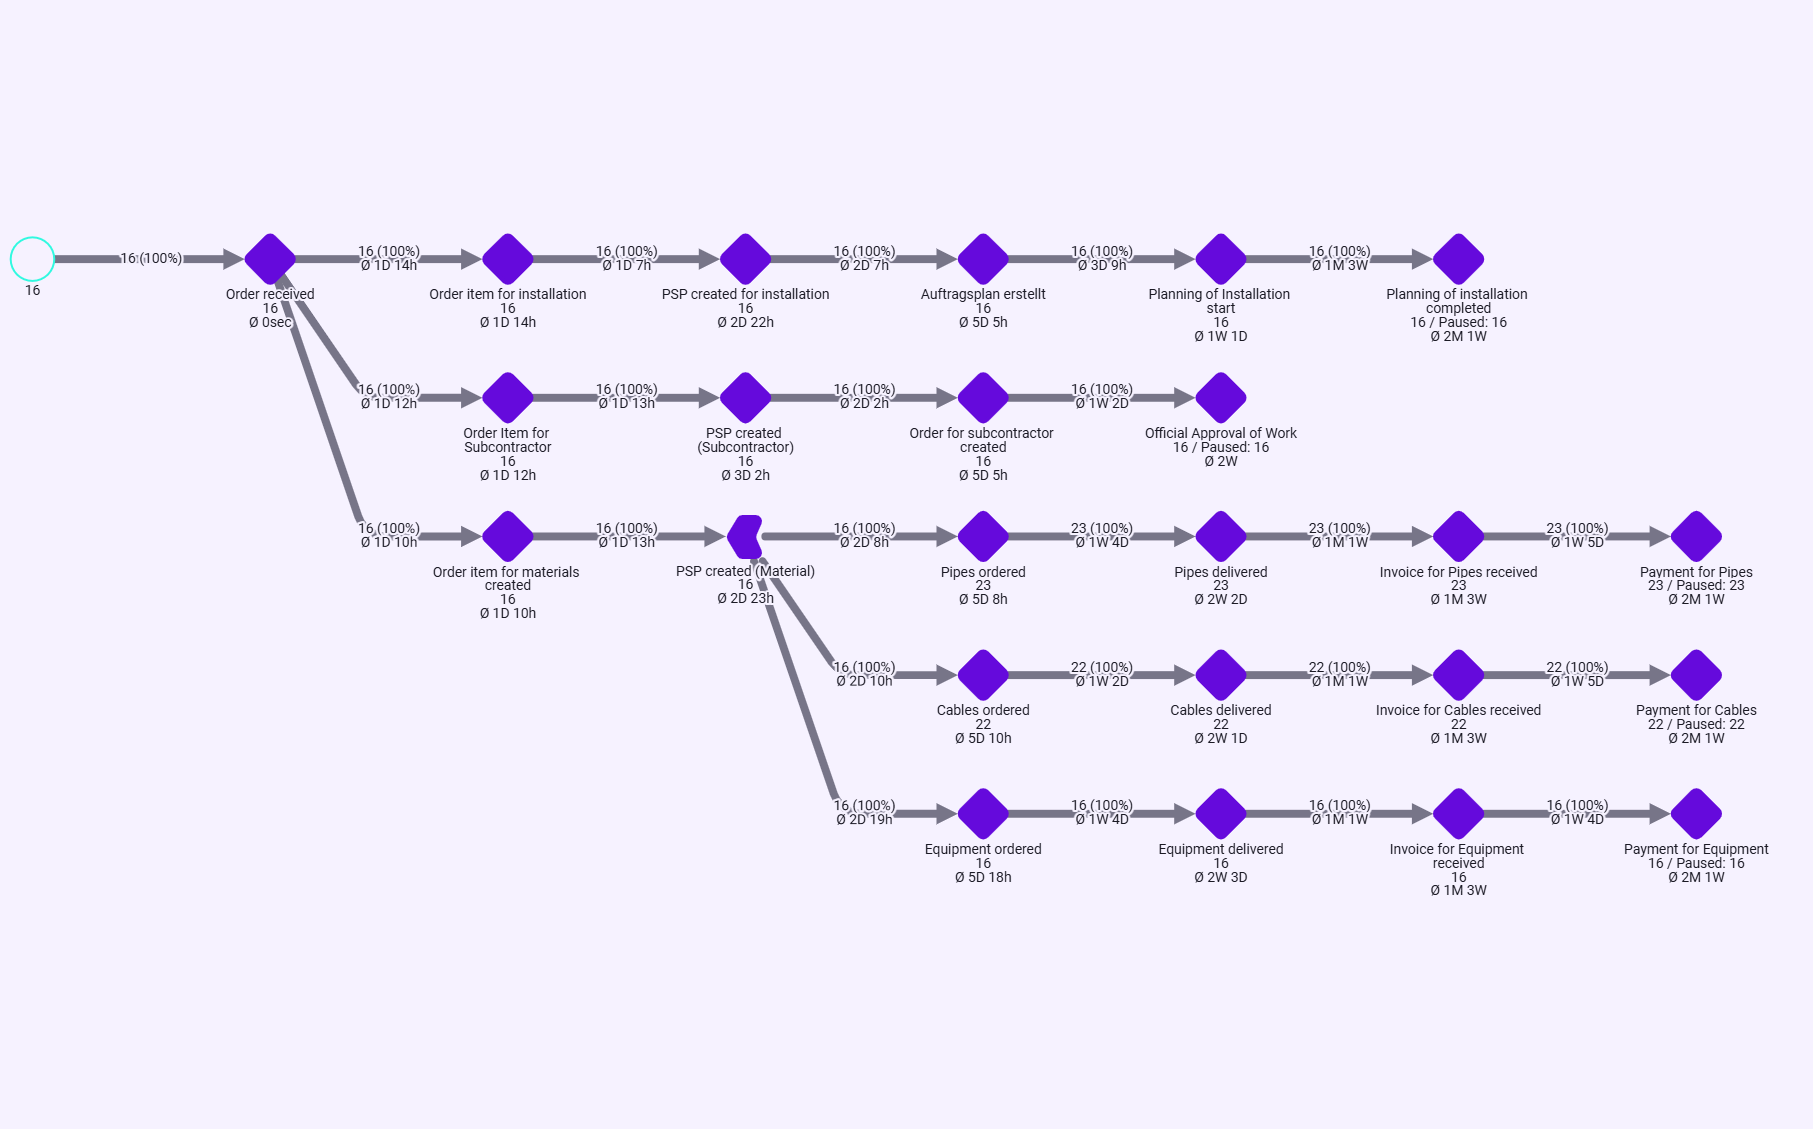
In this filtered view, several prerequisites are already well advanced. Nevertheless, the common next step is not reached.
This turns the activity analysis into a causal question: Which business prerequisite is still missing?
Single instance: from symptom to concrete cause
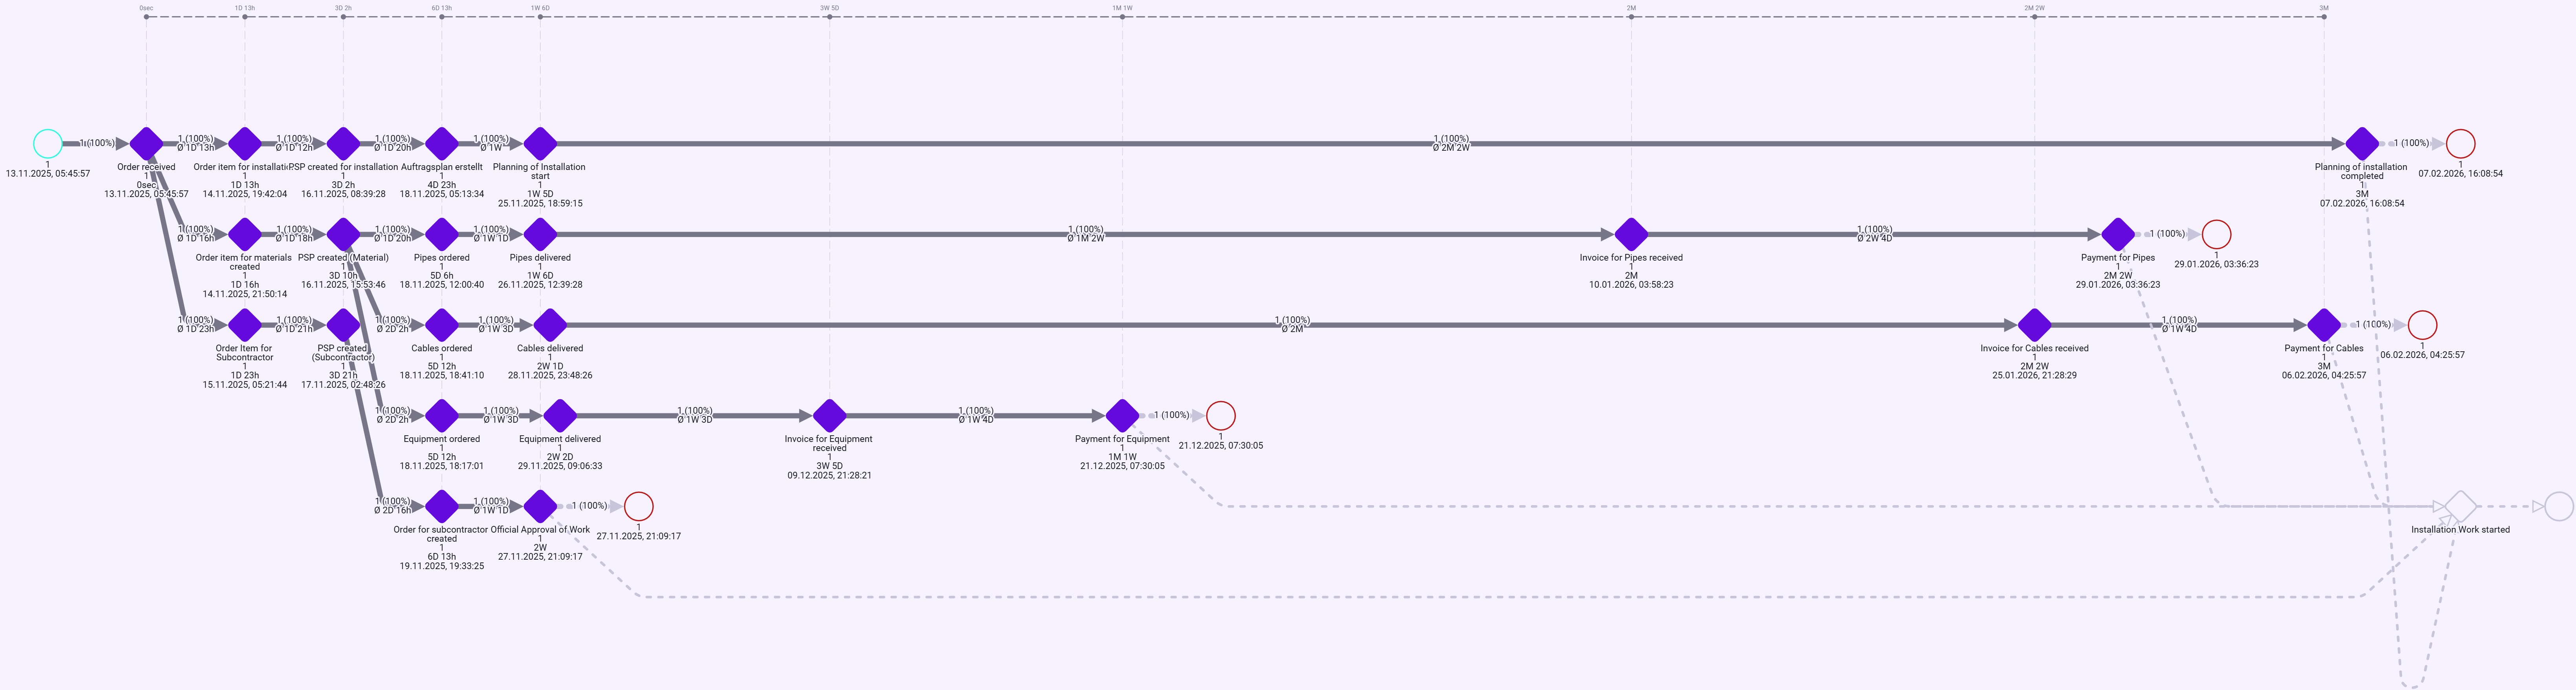
In this business case, planning, external services and several material strands are already completed or well advanced. Nevertheless, construction execution does not start.
In the stored process knowledge, however, the construction start is modeled as an AND dependency of several prerequisites. In this concrete demonstration case, the required customer down payment is missing.
This makes it possible to distinguish between a temporal observation and a business explanation:
Observation: The construction start does not occur.
Explanation: The construction start does not occur, even though several technical prerequisites are met, because a necessary commercial prerequisite is missing.
This is the core of causal process logic:
Noreja knows not only what has happened, but also which prerequisites must be met for something to be able to happen.
8. Bundling: when the cause lies outside the individual case
The logic can go one step further.
Imagine three district heating connections on the same street. Each connection has its own planning, material requirements, permits and house connections. Operationally, however, it would make little sense to excavate the same street separately for each connection.
The network operator can therefore bundle several connections into a single common civil engineering measure.
Then connection A can be fully ready – and still wait. Perhaps connection B is still missing a permit, or connection C is missing some other prerequisite.
From the isolated history of connection A, only an unexplained idle time would be visible.
Only when the relationship to the common civil engineering measure and to the other connections is known does the cause become understandable:
Connection A is not waiting because of an error within its own process, but because of a dependency on other process instances.
This example is deliberately theoretical and not a measured finding of the synthetic dataset shown. It does, however, illustrate an important methodological point:
Not every cause of a process problem lies within the same process instance.
It is precisely such cross-instance relationships that are a strong argument for an Event Knowledge Graph approach.
9. Minerva: start with the business question instead of with view and filter
The more perspectives, objects, error patterns and time series are available, the more powerful the analysis becomes – but the more complex the operation can also become.
A process manager should therefore not have to know first which view, which filter or which visualization they need.
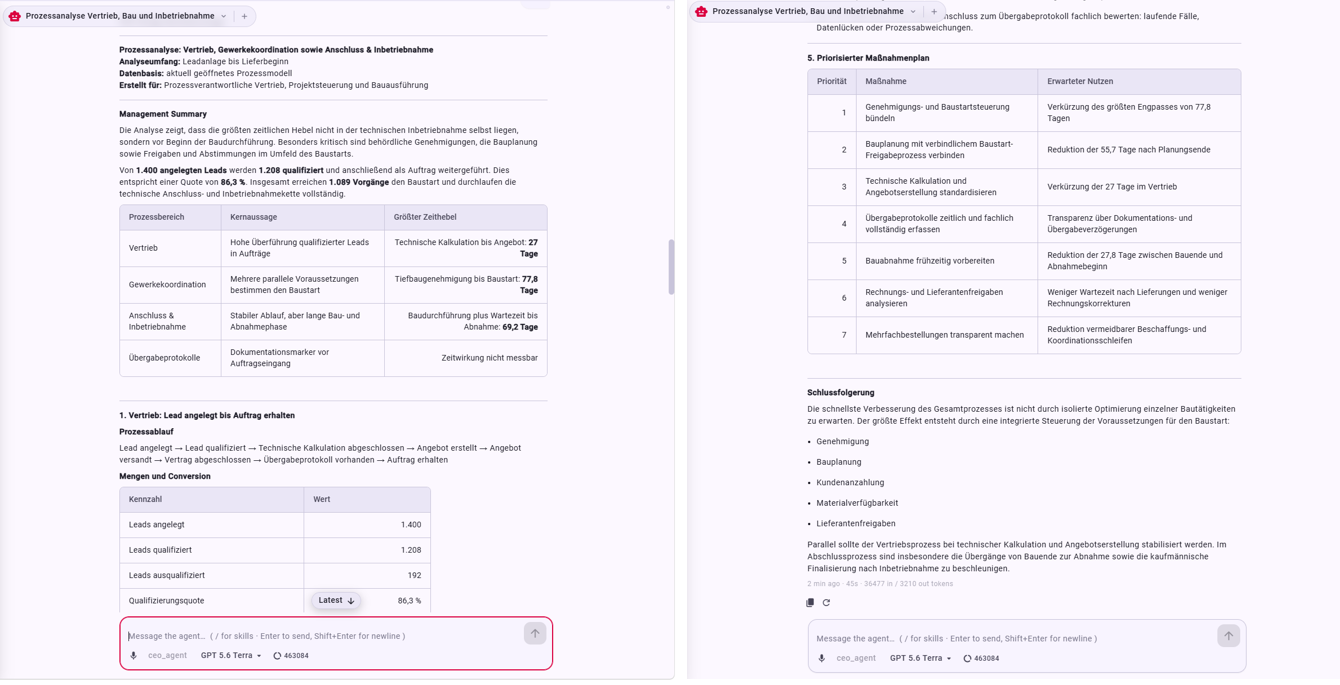
In the demo shown, Minerva is queried after a cross-cutting analysis of sales, trade coordination as well as connection and commissioning. The handover protocols are considered separately.
From this, Minerva produces a management summary, compares different process areas and identifies the biggest time levers. In the demo, longer times occur, among other things, in sales, in trade coordination and before or around construction execution.
The decisive benefit is not that AI replaces the process manager.
But rather:
The user can start with a business question, instead of having to know first which view, which filter and which visualization are needed for it.
Minerva uses the process knowledge stored in the knowledge graph, the perspectives and the available context to generate from them an analysis path and possible courses of action.
10. From finding to prioritized improvement initiative
A finding does not yet improve a process.
The analysis therefore does not end with the insight. The next question is: Which measure is actually worthwhile?
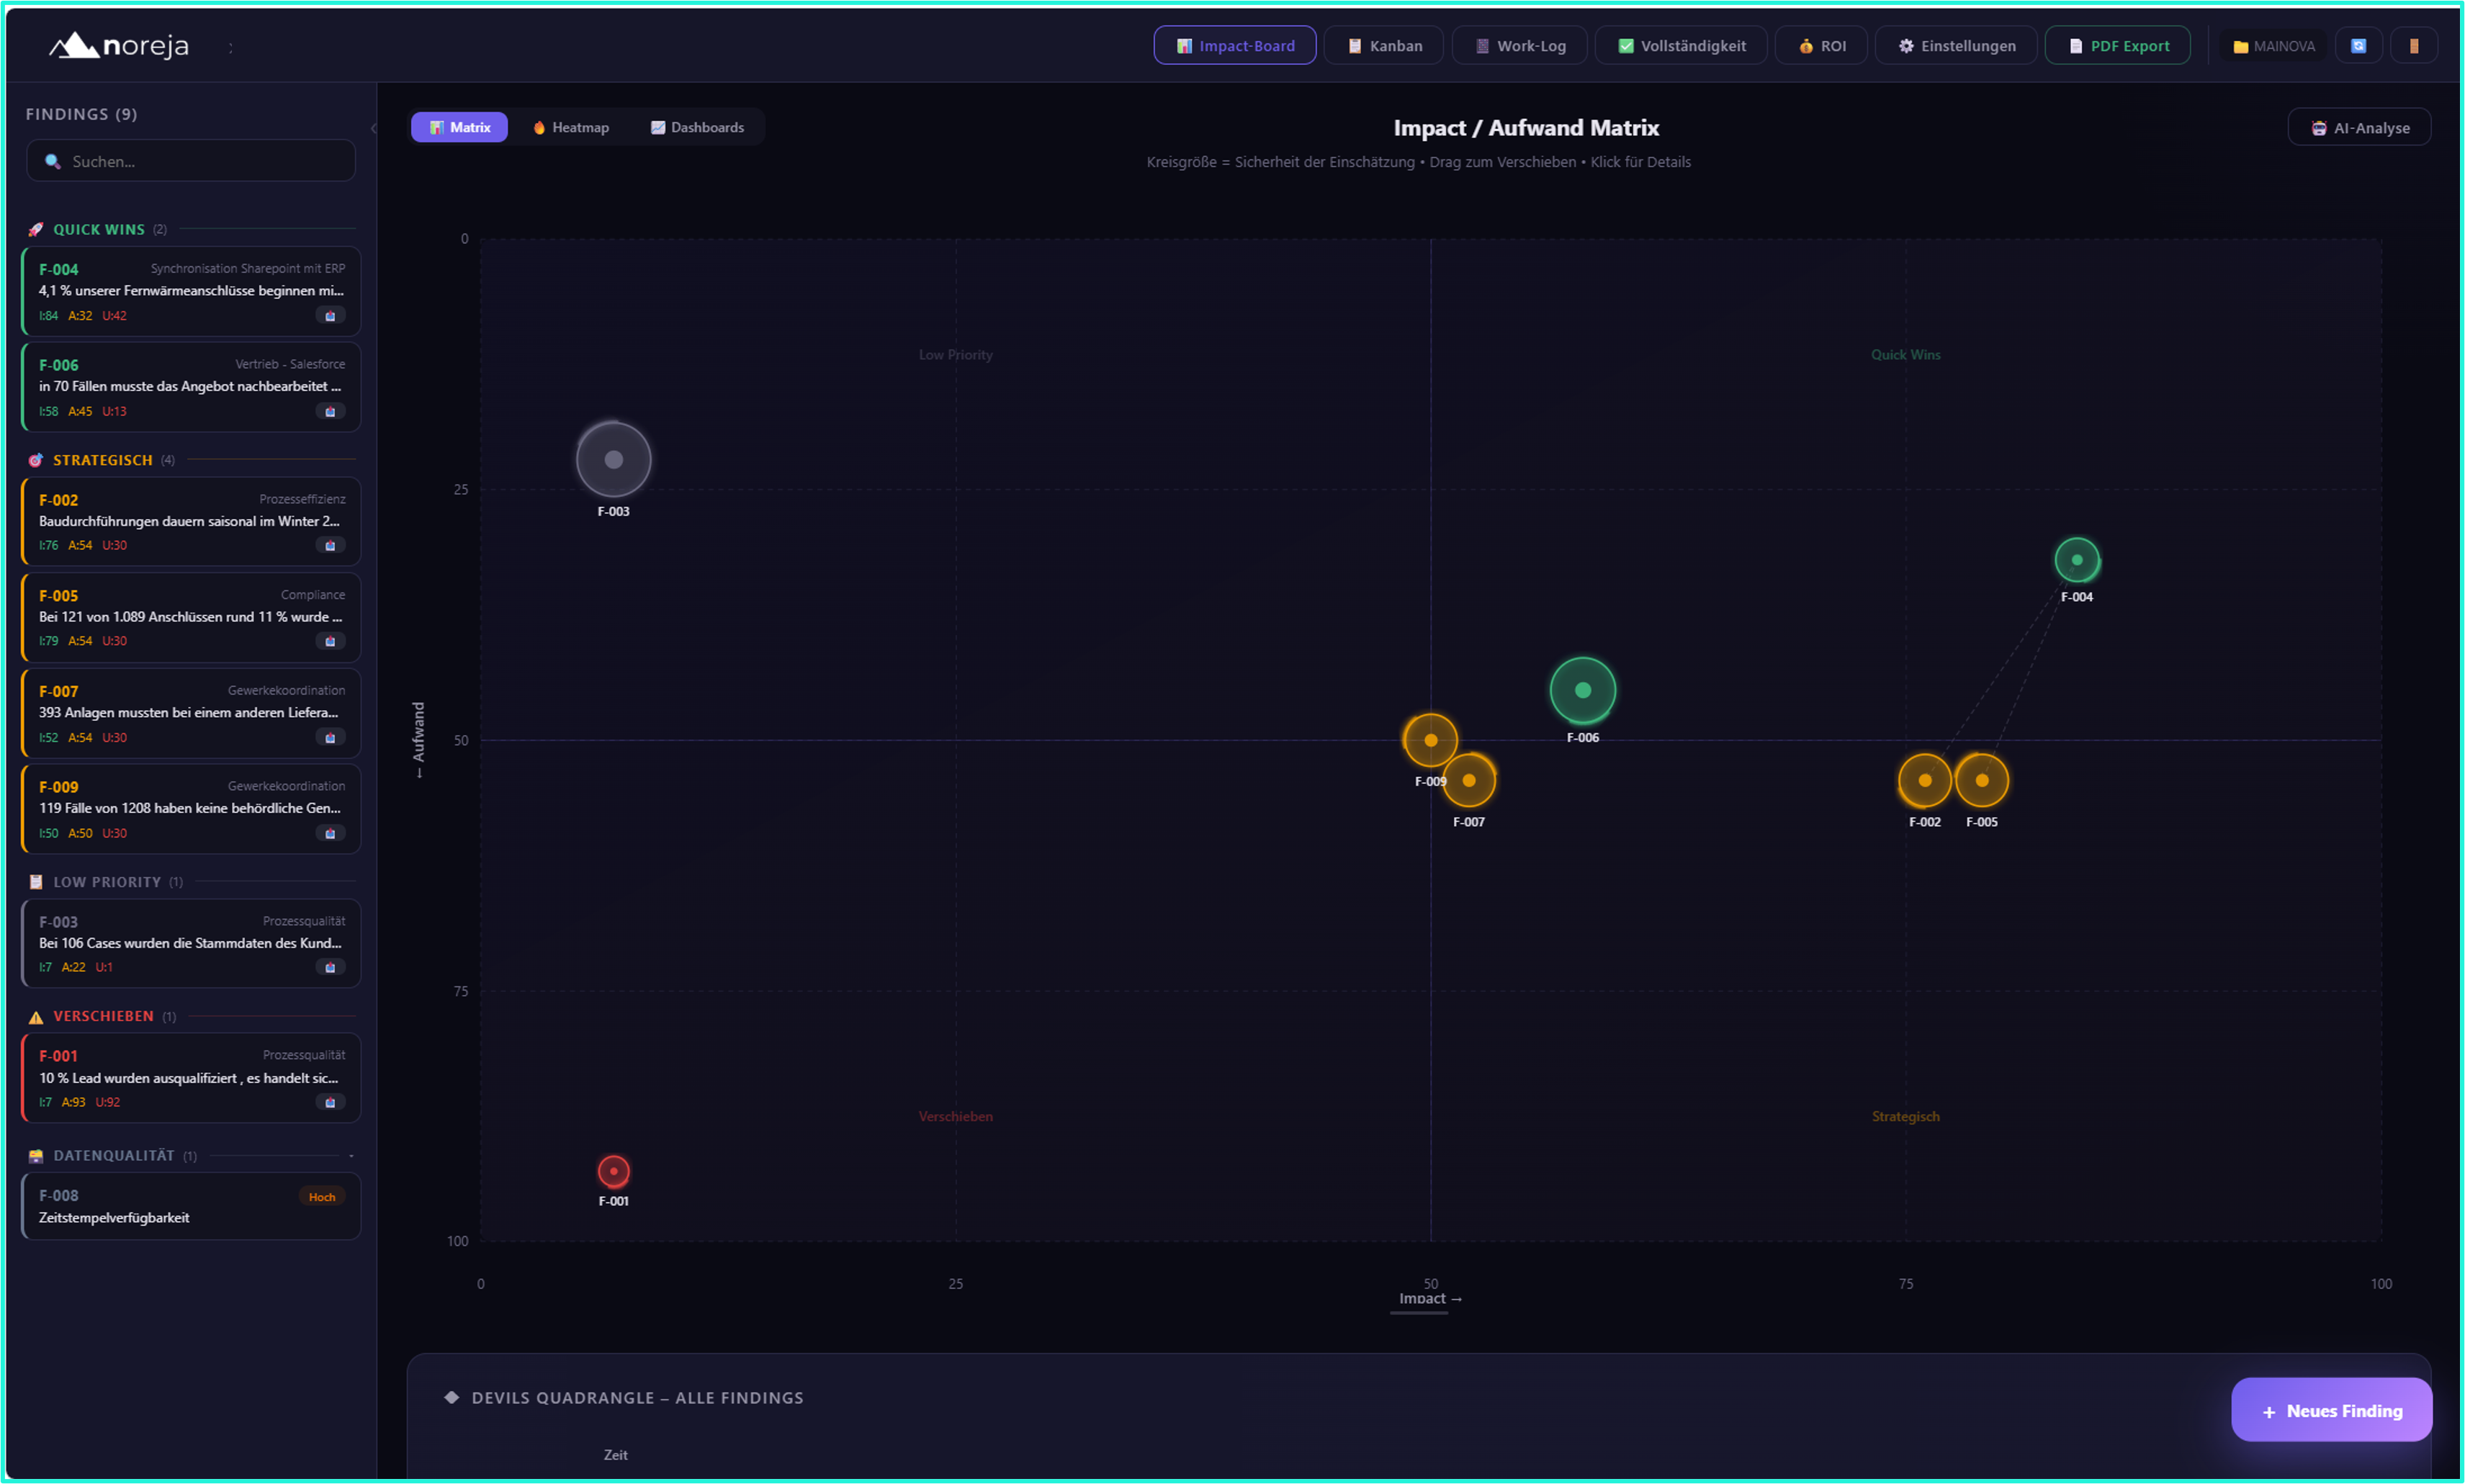
On the Impact Board, findings are assessed by impact, implementation effort and uncertainty. This allows them to be classified as quick wins, strategic initiatives, low-priority topics or measures to be deferred.
A finding can additionally be documented with the evidence from the analysis.
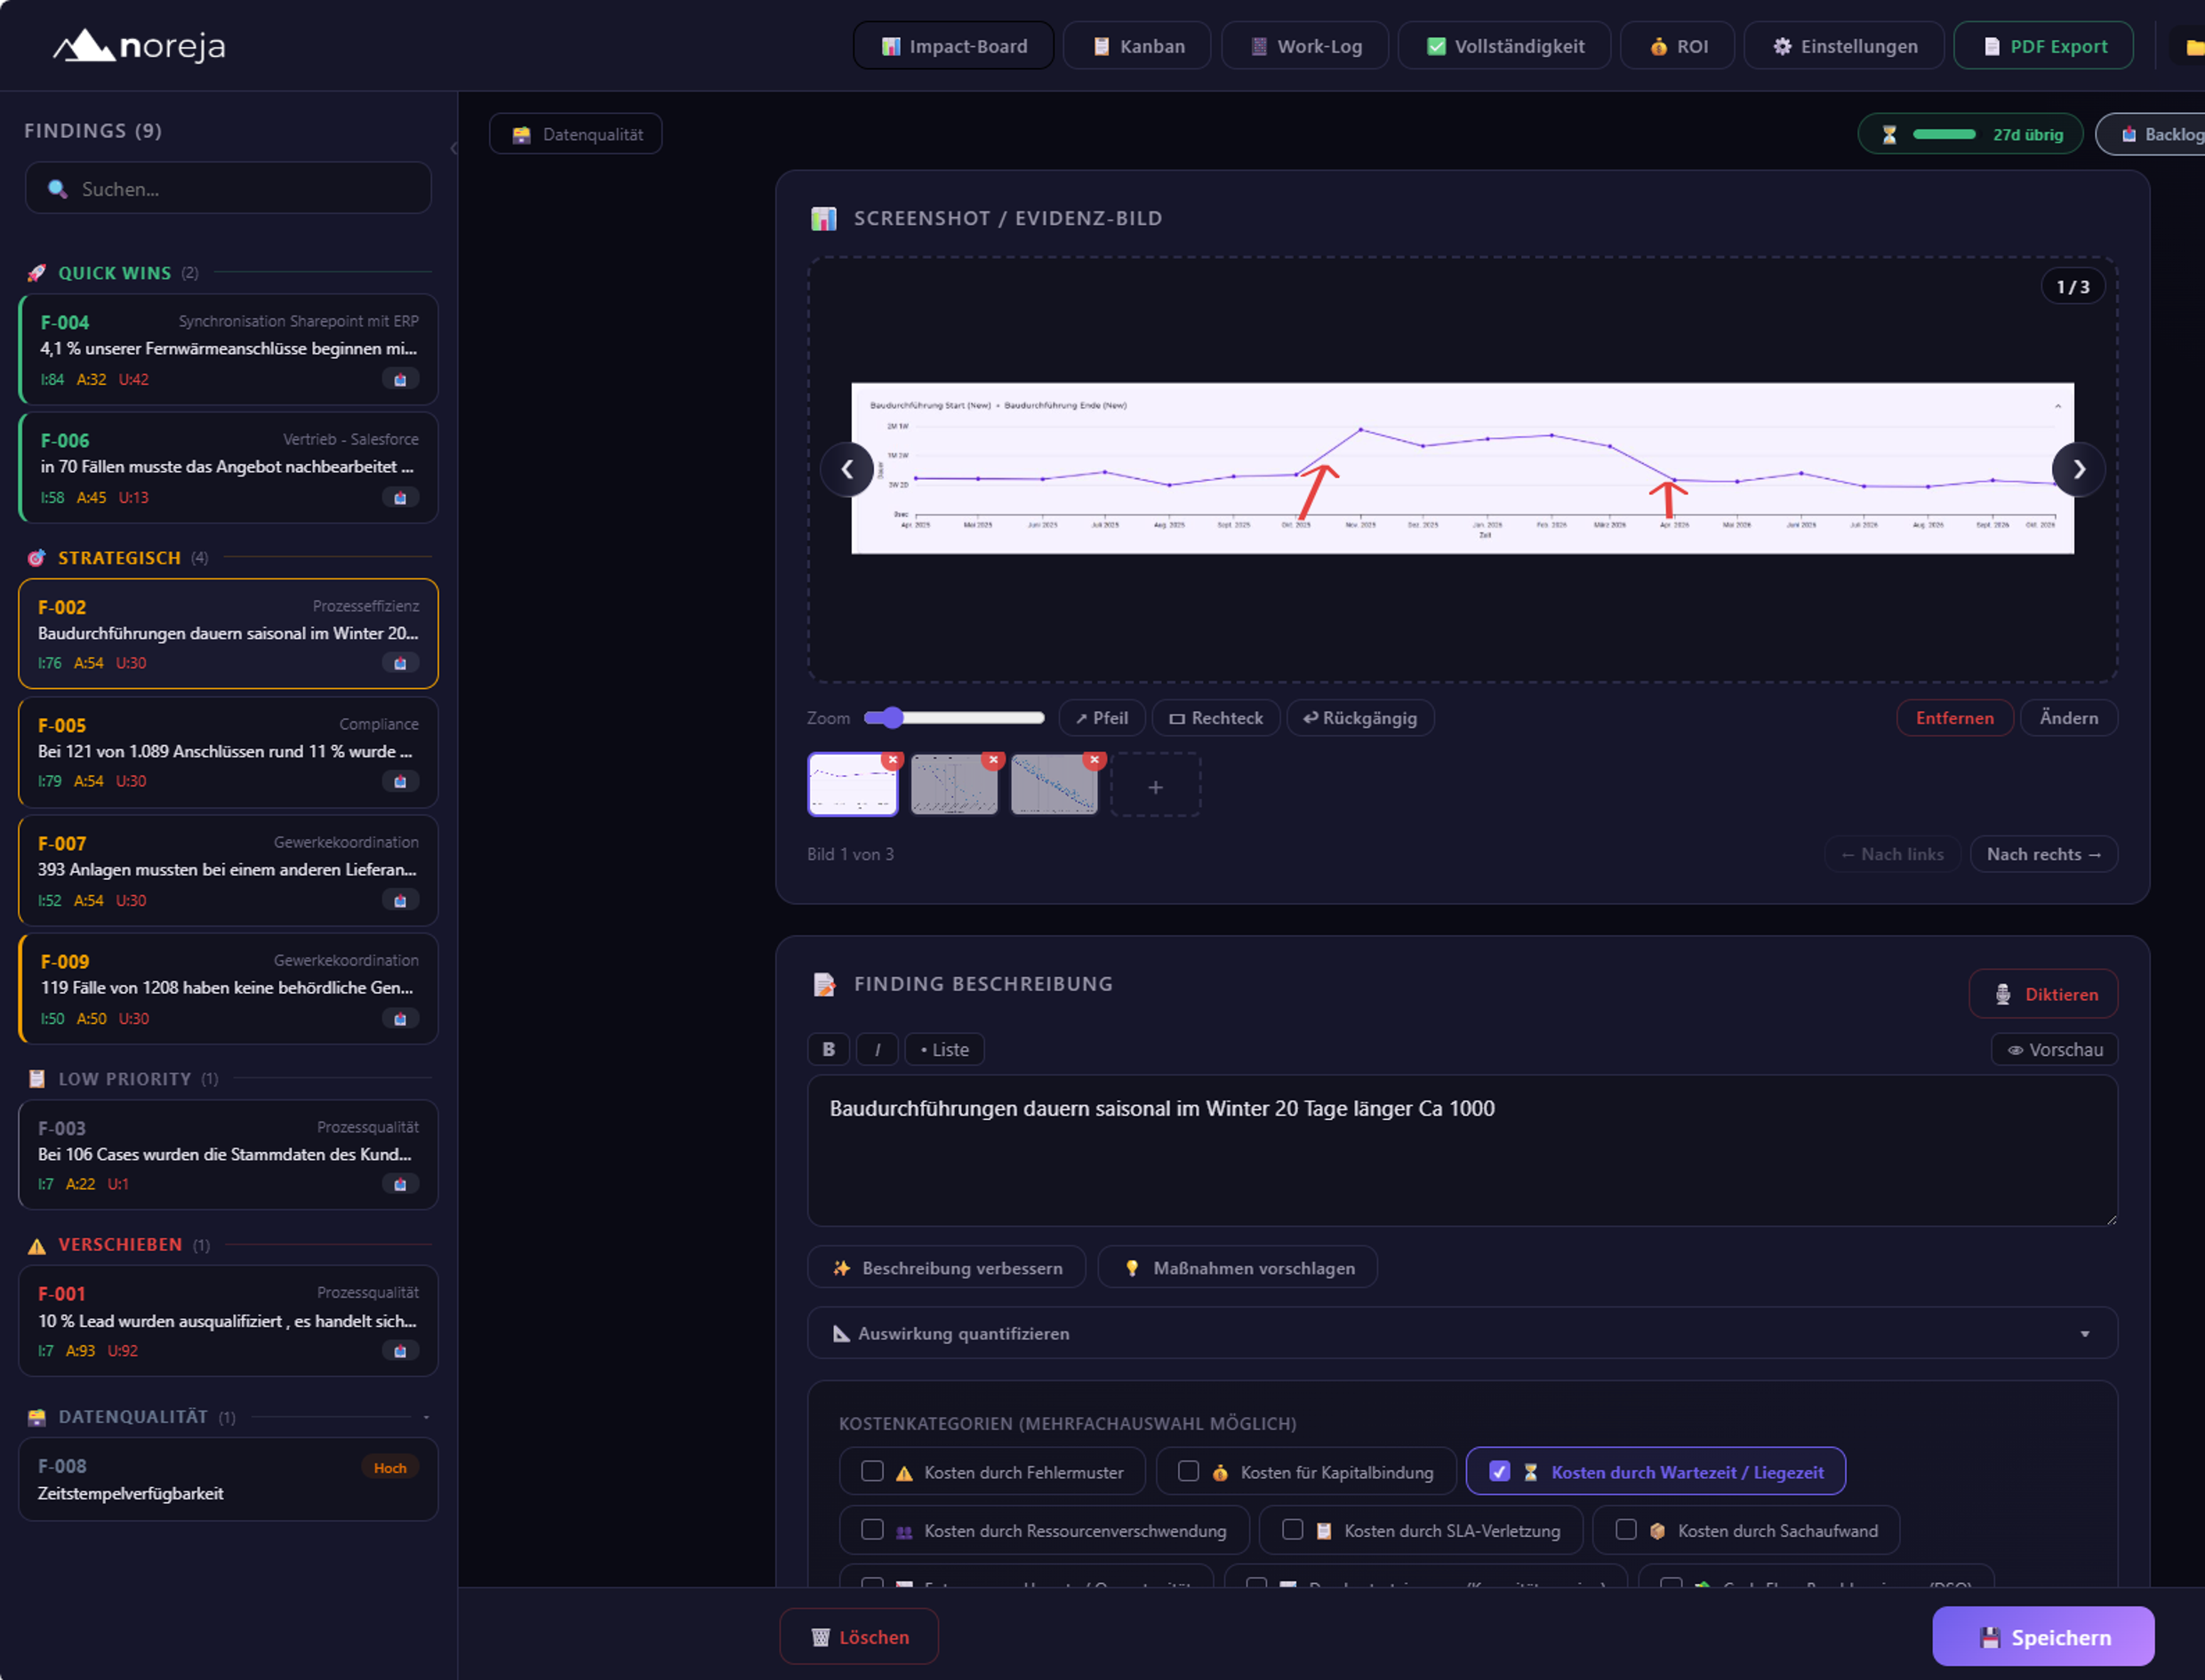
A process anomaly thus becomes a concrete improvement initiative. For the assessment, different cost and impact categories can be used, for example waiting time, resource waste, SLA violation, capital lockup, lost revenue, compliance risk or rework.
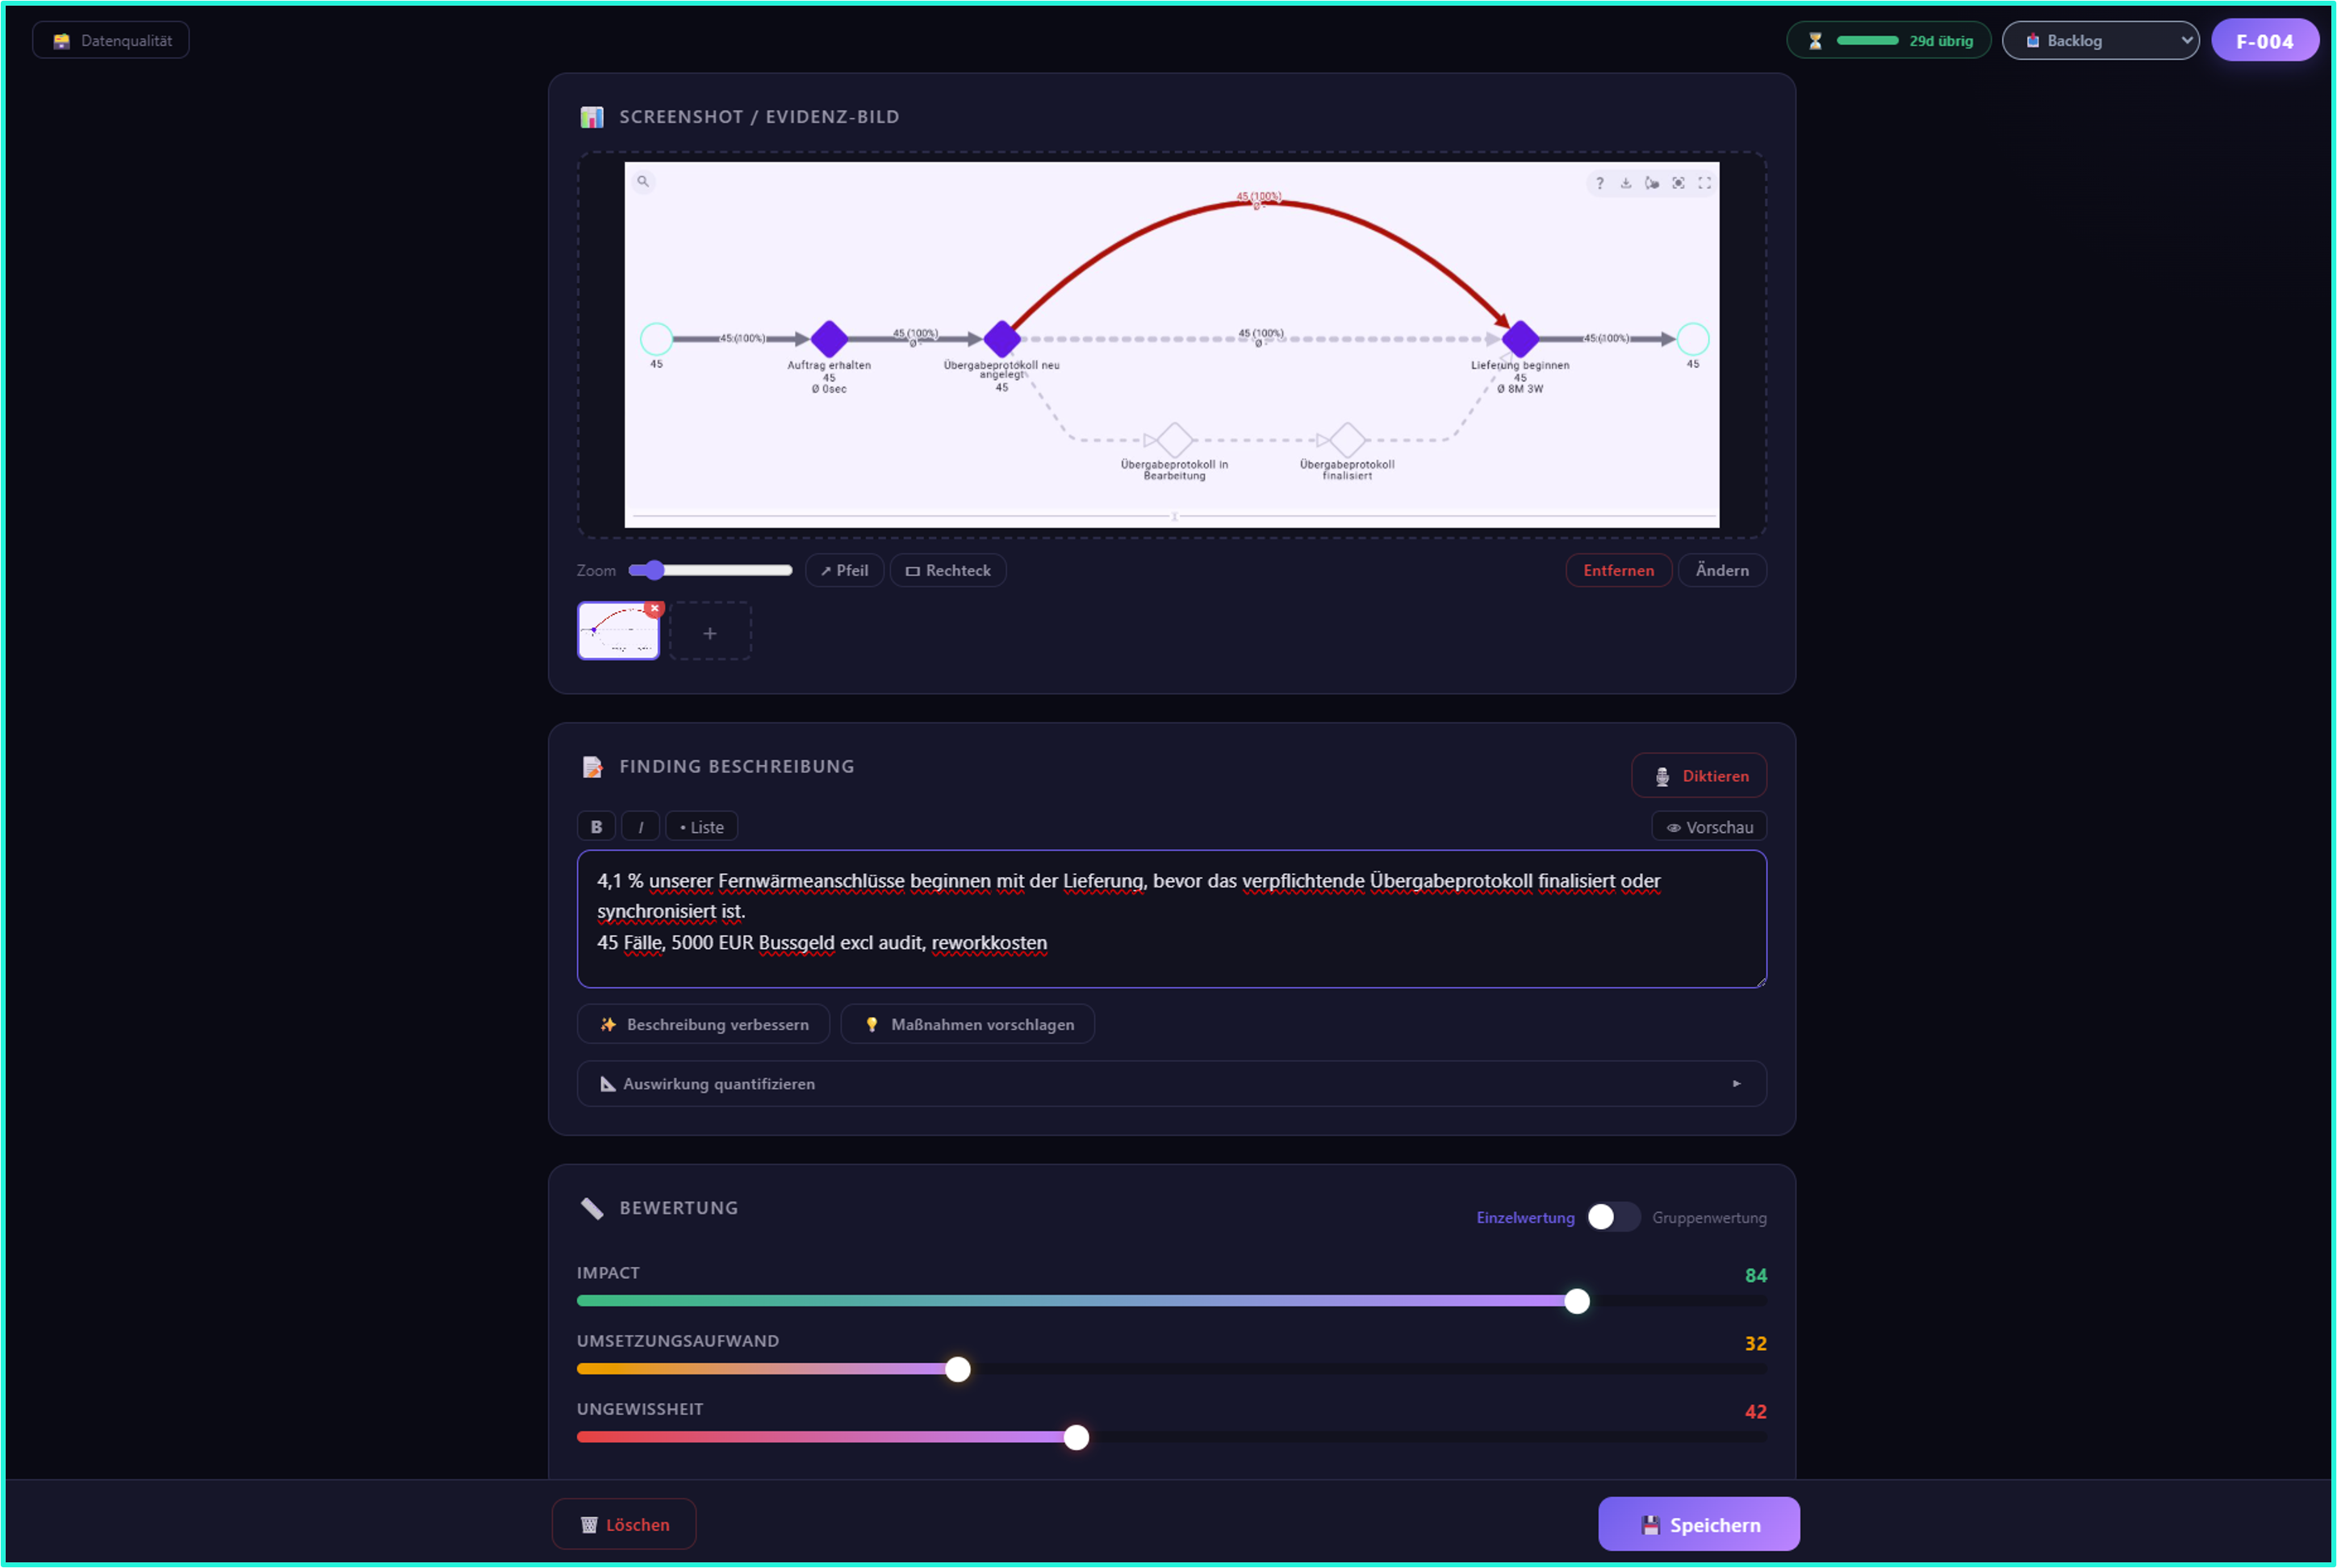
Minerva can propose possible measures. The decision, however, remains with the human.
Process excellence and the business department jointly assess which measure is economically and organizationally sensible.
In this way, analytical evidence becomes a prioritizable decision.
11. The actual cycle: insight, action, impact, feedback
The complete improvement process does not end with implementation.
After a measure, it must be checked again:
- Has the lead time actually improved?
- Has an error pattern become rarer?
- Has the affected process section stabilized?
- Has the expected impact actually materialized?
This creates a closed cycle:
Insight → Action → Impact → Feedback
Or from the process manager's point of view:
Detect → understand → assess → implement → measure.
Especially as the use of AI and automation increases, this last step becomes more important. The question is not only: "Have we now deployed AI or automation?"
But:
"Has the process actually become faster, more stable or qualitatively better as a result?"
Conclusion: don't start with the tool, start with the process question
The district heating connection shows why complex processes can rarely be understood with a single process map.
The end-to-end perspective shows the overall picture. The sales perspective makes drop-offs and rework visible. Trade coordination explains parallel prerequisites and common milestones. The handover protocols show that real process states and digital timestamps can diverge.
All perspectives, however, draw on the same process knowledge.
From this, four central principles emerge:
- Preserve granularity: business objects and their relationships are not aggregated away into a flat event log too early.
- Reduce complexity in business terms: perspectives answer concrete process questions without losing the underlying information.
- Analyze causes instead of only anomalies: process behavior is assessed against business and causal dependencies.
- Operationalize insights: findings become measures, are assessed economically and are then measured again against the process data.
The perhaps most important insight is therefore:
Transparency alone is not enough. For process improvement you need an explanation – and then the proof that the chosen measure actually works.