
Order-to-Cash: Touchless, but not at the cost of quality.
Note on the demo: All figures on this page come from a synthetic order-to-cash dataset. They illustrate analysis paths, business relationships and methods of Causal Process Mining and are not a customer's production figures.
Many order-to-cash initiatives pursue the same goals: more automation, reliable deliveries and fewer complaints. A high touchless rate initially looks like the logical target metric. The fewer manual interventions, the more efficient the process.
But not every manual step is waste. Some reviews prevent errors, others really only cost time. The key question is therefore not how many reviews can be eliminated, but which orders can safely be automated and which deliberately need a human.
Touchless is not a goal in itself. What matters is which orders need a human and which don't.
What is order-to-cash?
Order-to-cash (O2C) describes the end-to-end process from order receipt to payment clearing. In an industrial company, this typically includes order receipt and order creation, configuration and release, delivery processing and shipment, invoicing, payment or dunning, as well as complaints and rework.
On a process slide, O2C often looks linear. In the operational data, however, the flow is a network of interconnected business objects and business dependencies. Even between order receipt and release, the sales channel, automatic or manual entry, credit check, configuration, changes and order review can trigger different paths. Later, delivery, invoice, payment, dunning, credit note or complaint are added.
Causal Process Mining preserves this granularity and these relationships. Only for a specific business question is a suitable Causal Perspective derived from it. In this article, we deliberately focus on the complaint path and the question of when a manual order review actually makes sense. Other automation hypotheses – for example on the order channel or the credit check – were also identified but are not explored further here.
Complexity is reduced during the analysis – not already during data import.
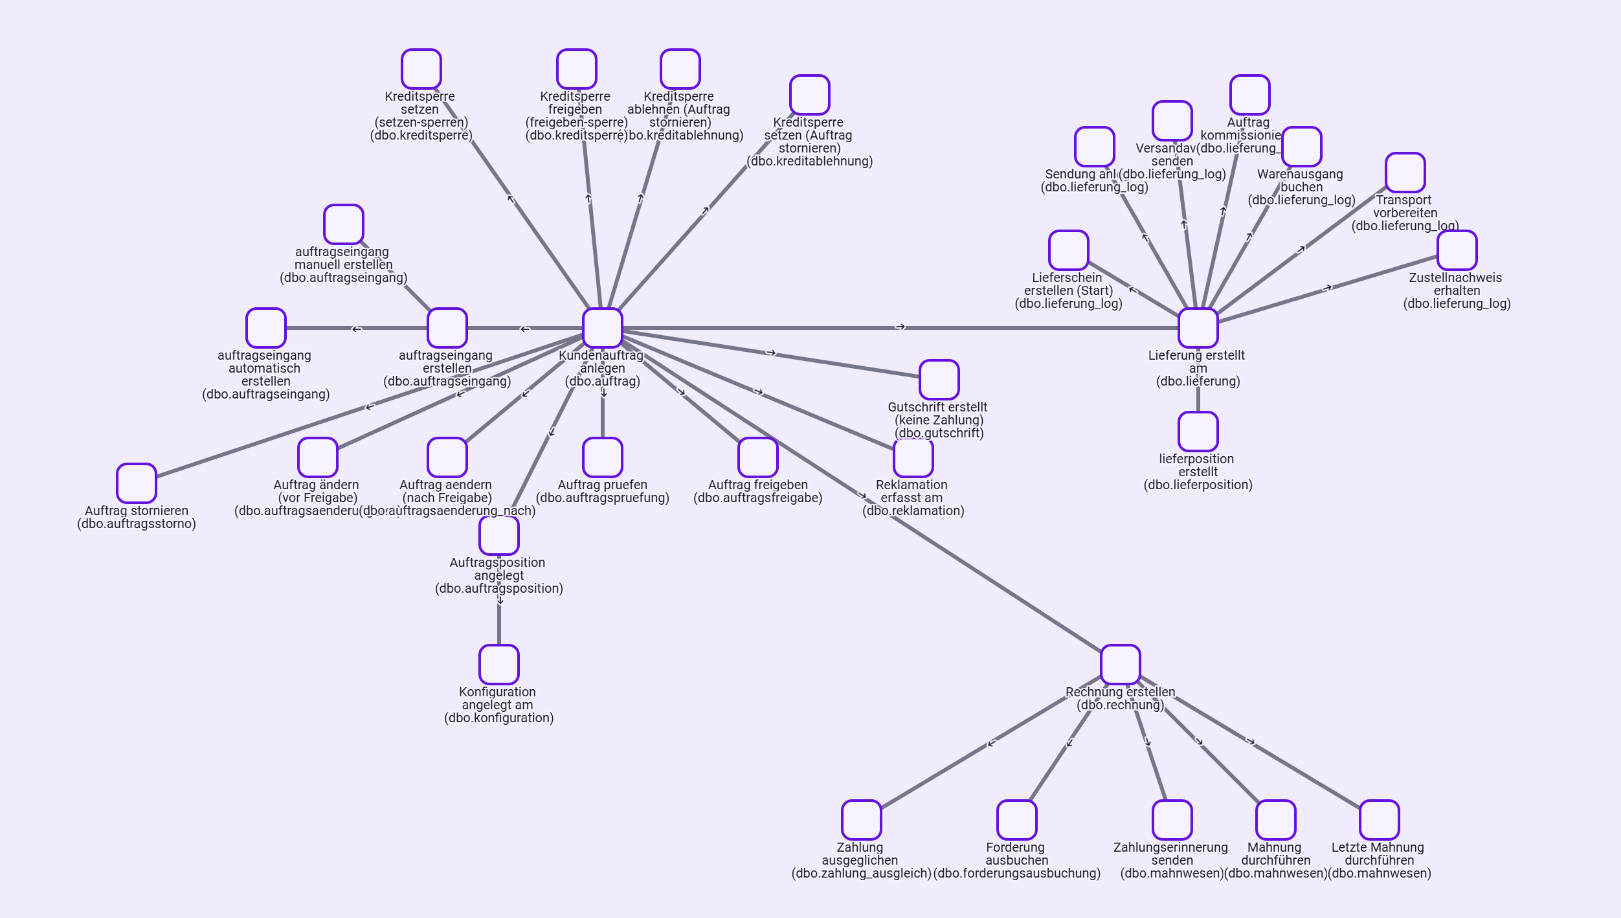
Event Knowledge Graph of the O2C process – showing the connected business objects around sales order, order item and configuration as well as delivery, invoice, payment, dunning, credit note and complaint
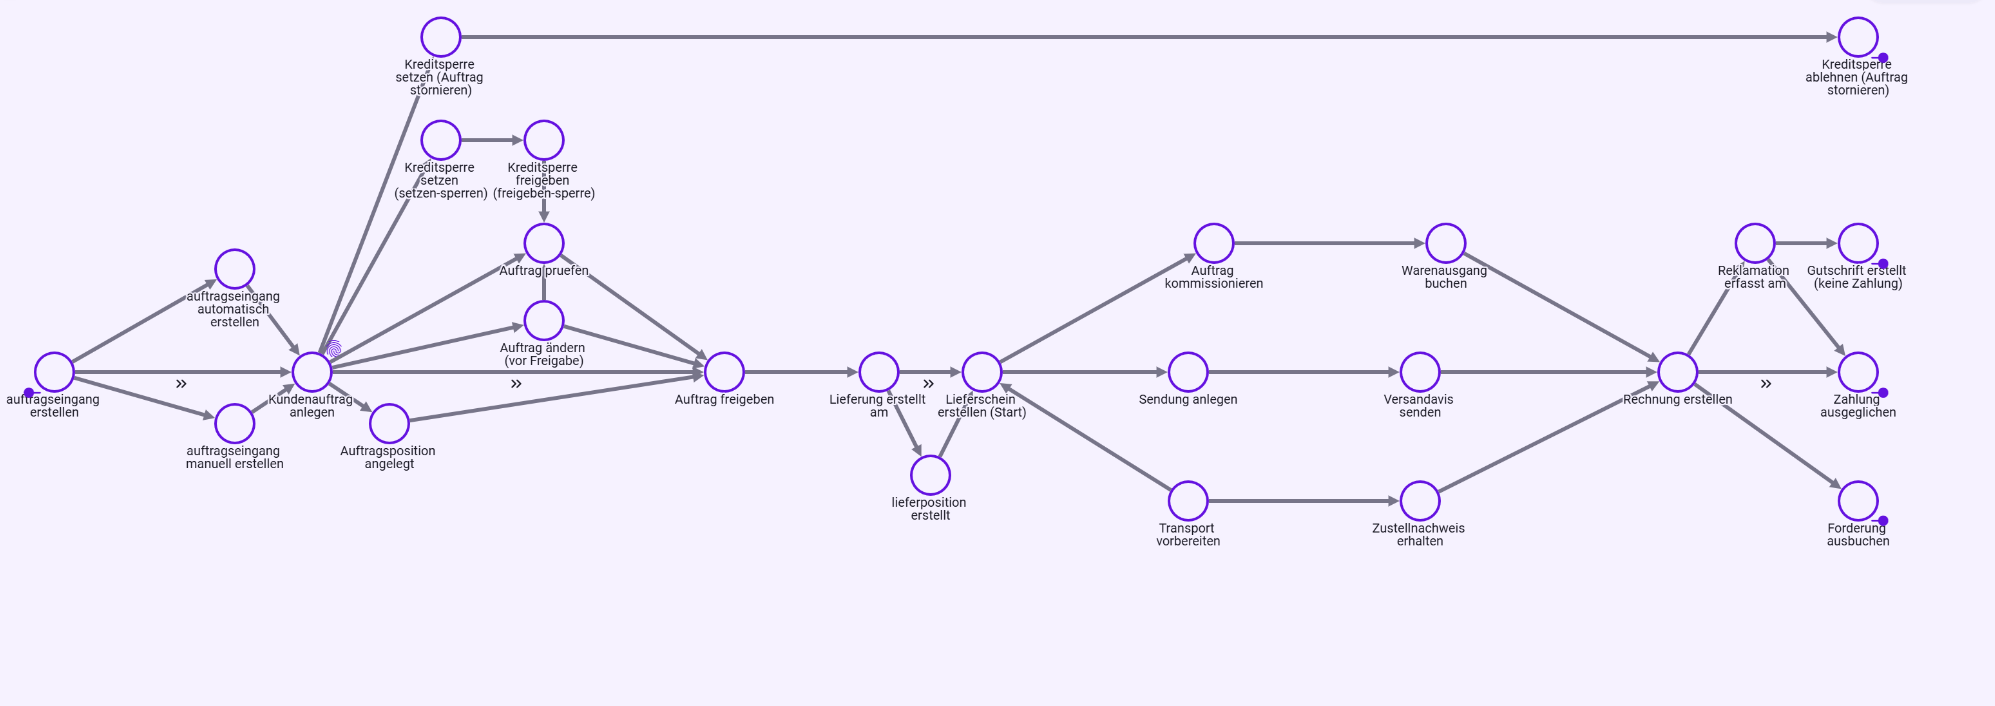
Overall view – business causal perspective of the O2C process from order receipt through release and delivery processing to invoice, payment and complaint.
At a glance
| Metric | Result | Context |
|---|---|---|
| Sales orders | 4,500 | entire O2C dataset |
| Touchless rate | 46.37% | 1,978 of 4,266 consistently assessable orders |
| OTIF rate | 86.92% | 3,708 of 4,266 consistently assessable orders |
| Complaints | 207 cases | 4.60% based on all 4,500 orders; 4.85% in the KPI view of 4,266 assessable orders |
| Complaints from technical and service configurations | 76.33% | with only a 35.42% share of the order base |
| Changed orders without the intended review path | 197/340 cases | around 58% go directly to release after the change |
The process in three phases
The same order-to-cash process can be sliced differently depending on the question. The following three views show the most important business blocks.
1 · Order receipt, configuration and release
In the first block, the sales order and its items are created. Orders can be entered automatically or manually, trigger credit checks, and be configured, changed and reviewed. This is exactly where the lever for touchless processing lies: Which steps are necessary from a business perspective – and which can be automated based on risk?
Business objects: Sales order, order item, configuration, order change, order review, credit check.
Guiding question: Which orders can be released automatically – and which need a review because of their risk?
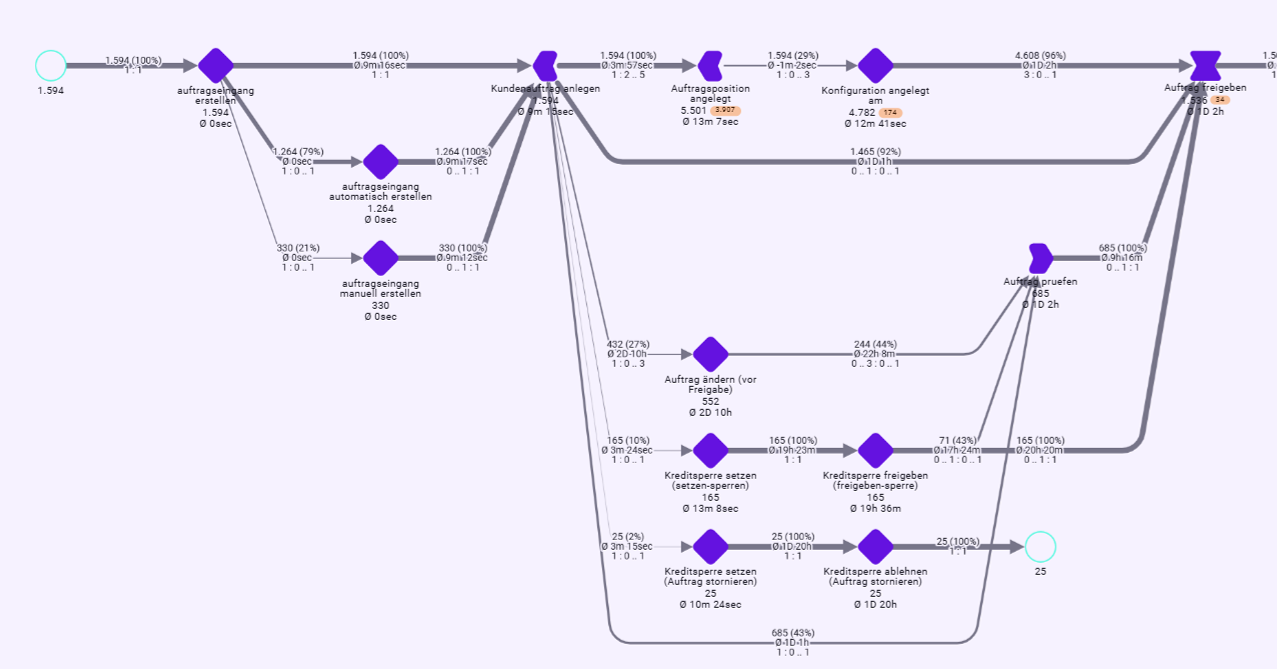
O2C analysis of order receipt, configuration, changes, credit check and release
2 · Delivery processing and billing
Release is followed by operational fulfillment. Delivery note, picking, goods issue, shipping or transport and proof of delivery form different, partly parallel object relationships. This perspective is suited, for example, to questions about OTIF, lead time and delivery performance.
Business objects: Sales order, delivery, shipment, transport, proof of delivery, invoice.
Guiding question: Where do deviations in delivery reliability and lead time arise – in our own flow or in connected delivery and transport objects?
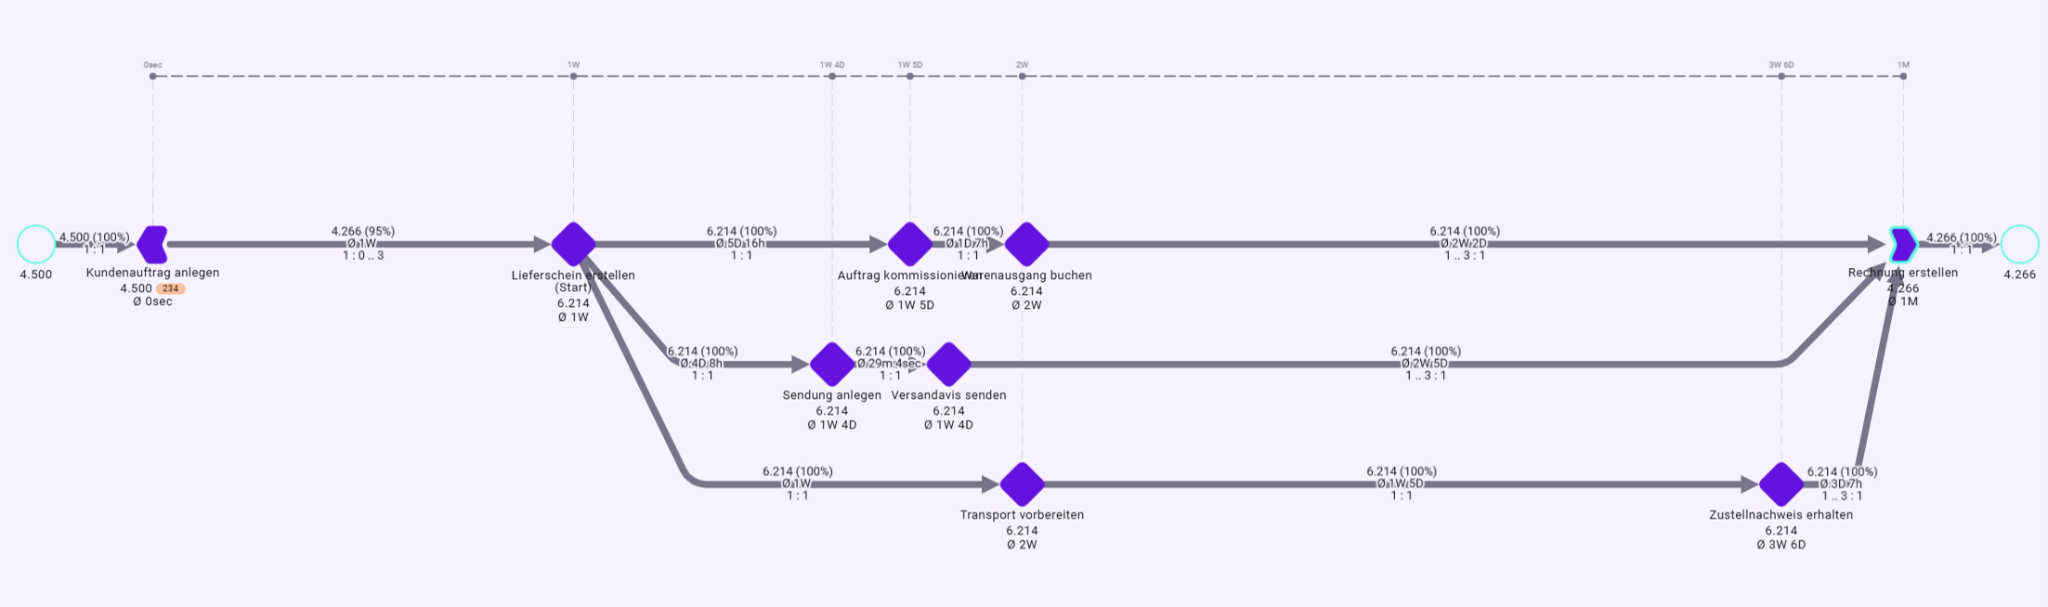
O2C analysis of delivery processing from delivery note through picking, shipping and transport to invoice
3 · Payment, dunning and complaints
After invoicing, the process can lead directly to payment clearing or run through payment reminder, dunning, credit note or write-off. Complaints form an additional business path. For the following analysis, we zoom in on exactly this quality question.
Business objects: Invoice, payment, receivable, credit note, complaint.
Guiding question: Which upstream process conditions explain complaints, payment delays or other downstream effects?
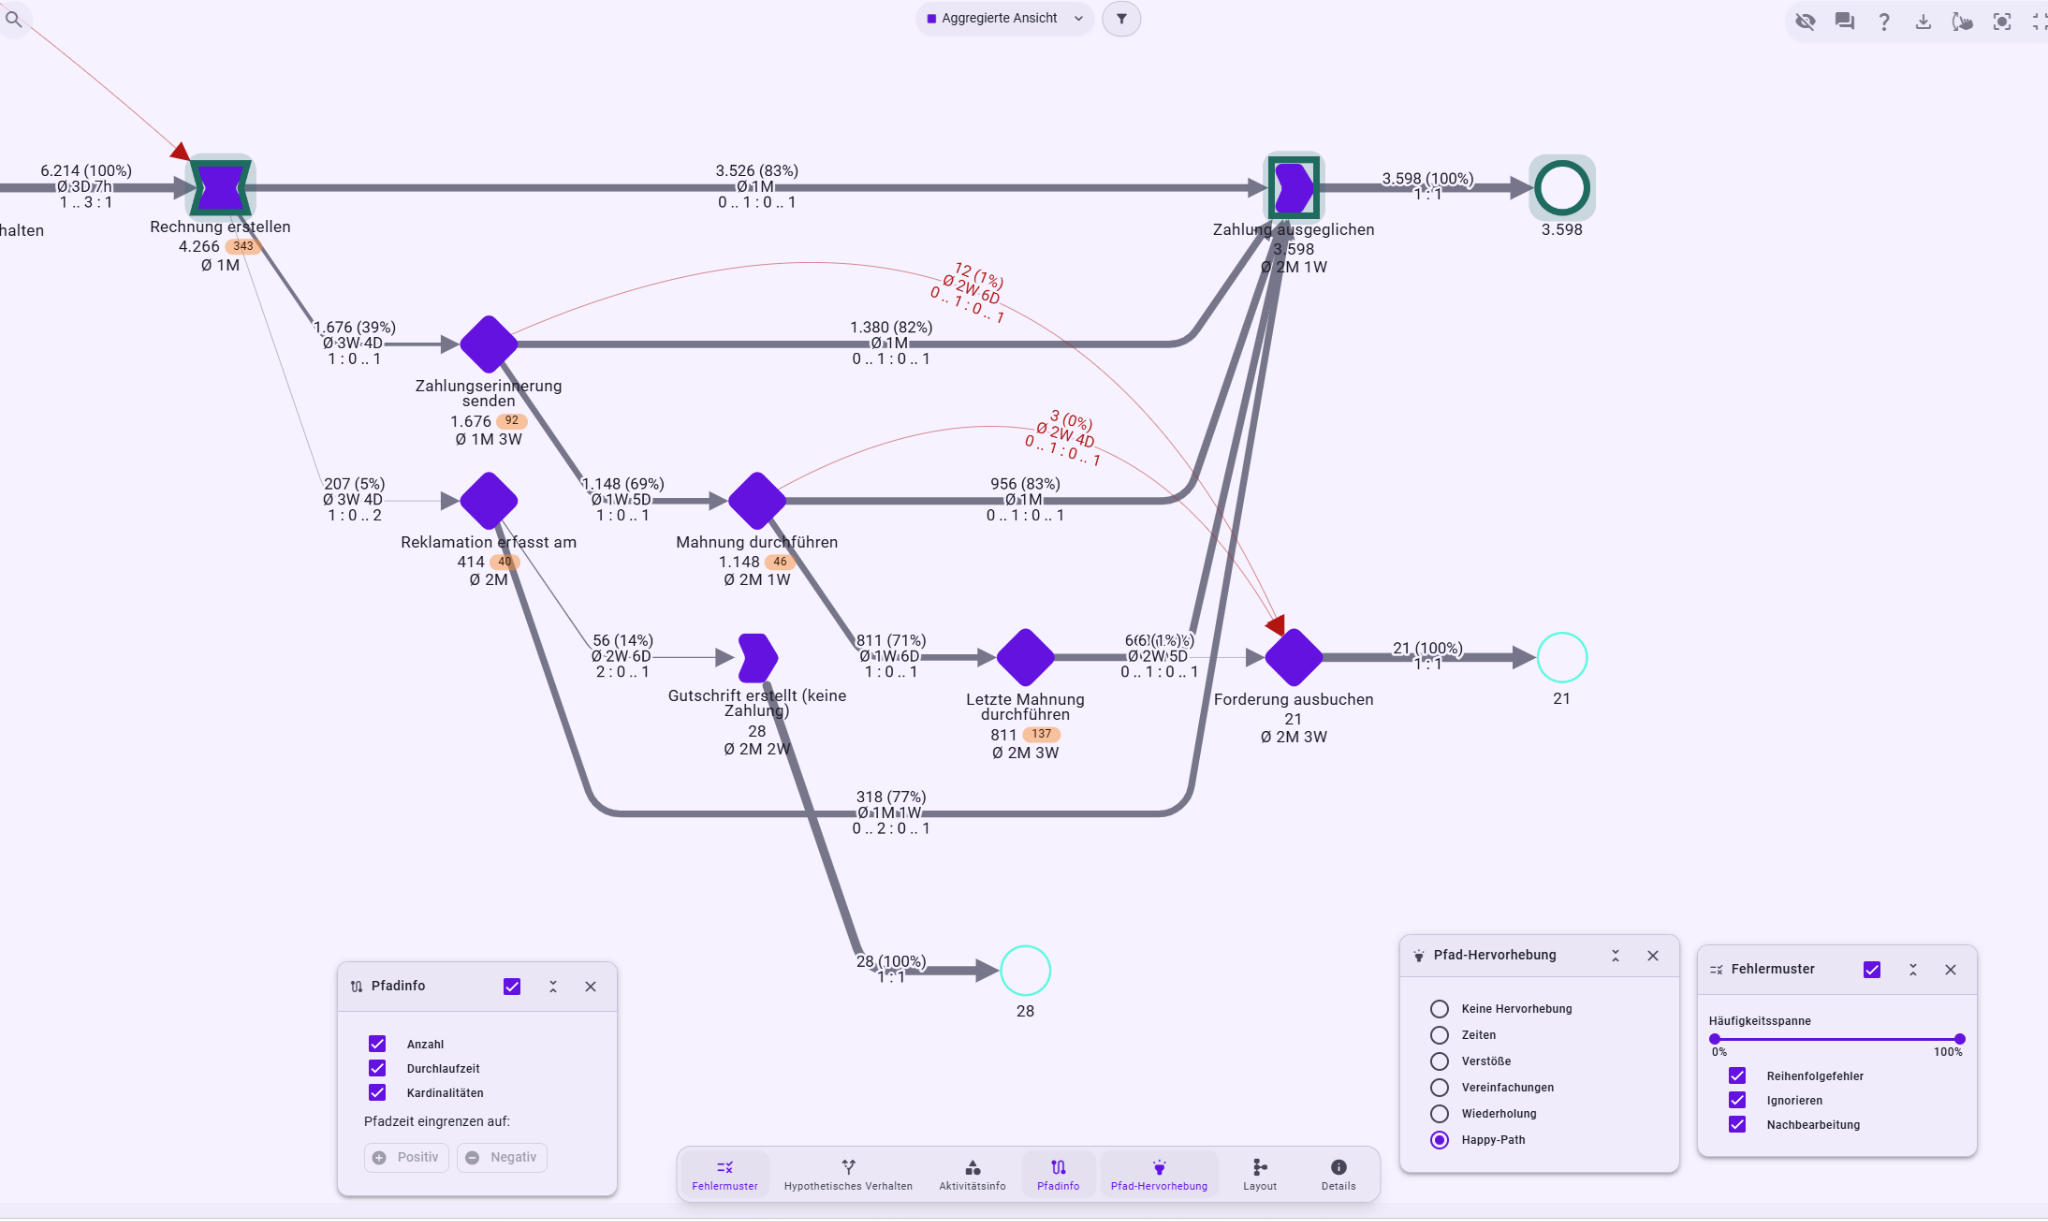
O2C analysis – payment and complaint paths with reminder, dunning, credit note, write-off and payment clearing.
A look at the KPIs
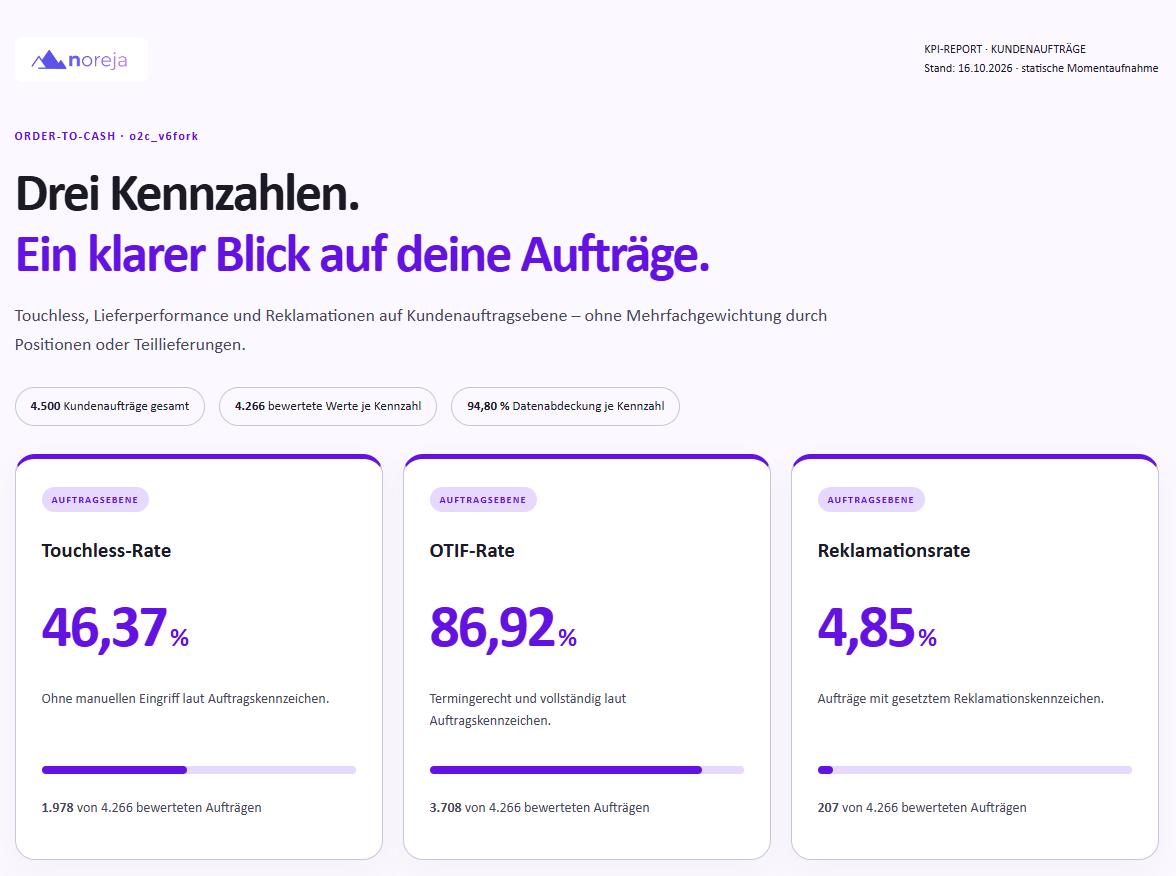
Management KPIs at order level: touchless, OTIF and complaint.
Five findings along the complaint path
The following findings deliberately follow the same pattern: from the visible KPI (What happened?) through error patterns and root-cause hypotheses (Why did it happen?) to a verifiable measure that reduces the cause. What matters is not only what stands out, but why a relationship is plausible and which explanation holds up under cross-checking.
Finding 1 · Touchless shows the What? but not yet the Why?
At 46.37%, not even every second assessed order runs fully touchless. The obvious reaction would be to cut manual steps as far as possible. But the metric doesn't say which intervention is superfluous and which protects quality and thus prevents complaints.
The right question is not: “How do we remove more manual steps?” But: “Which manual steps add no value, and which protect a risky order from a costly error?”
Finding 2 · Complaints concentrate on configured orders
The complaint perspective shows 207 orders with complaints. Standard products have a complaint rate of 1.69 percent, technical configurations 8.01 percent and service configurations 12.90 percent. Technical and service orders together make up only 35.42 percent of the order base but cause 76.33 percent of all complaints.
The complaint reasons are concentrated as well. “Service visit not as agreed” and “Incorrect configuration” together account for around 72.5 percent of the documented reasons. A complaint reason, however, initially only describes what was objected to – not why it happened.
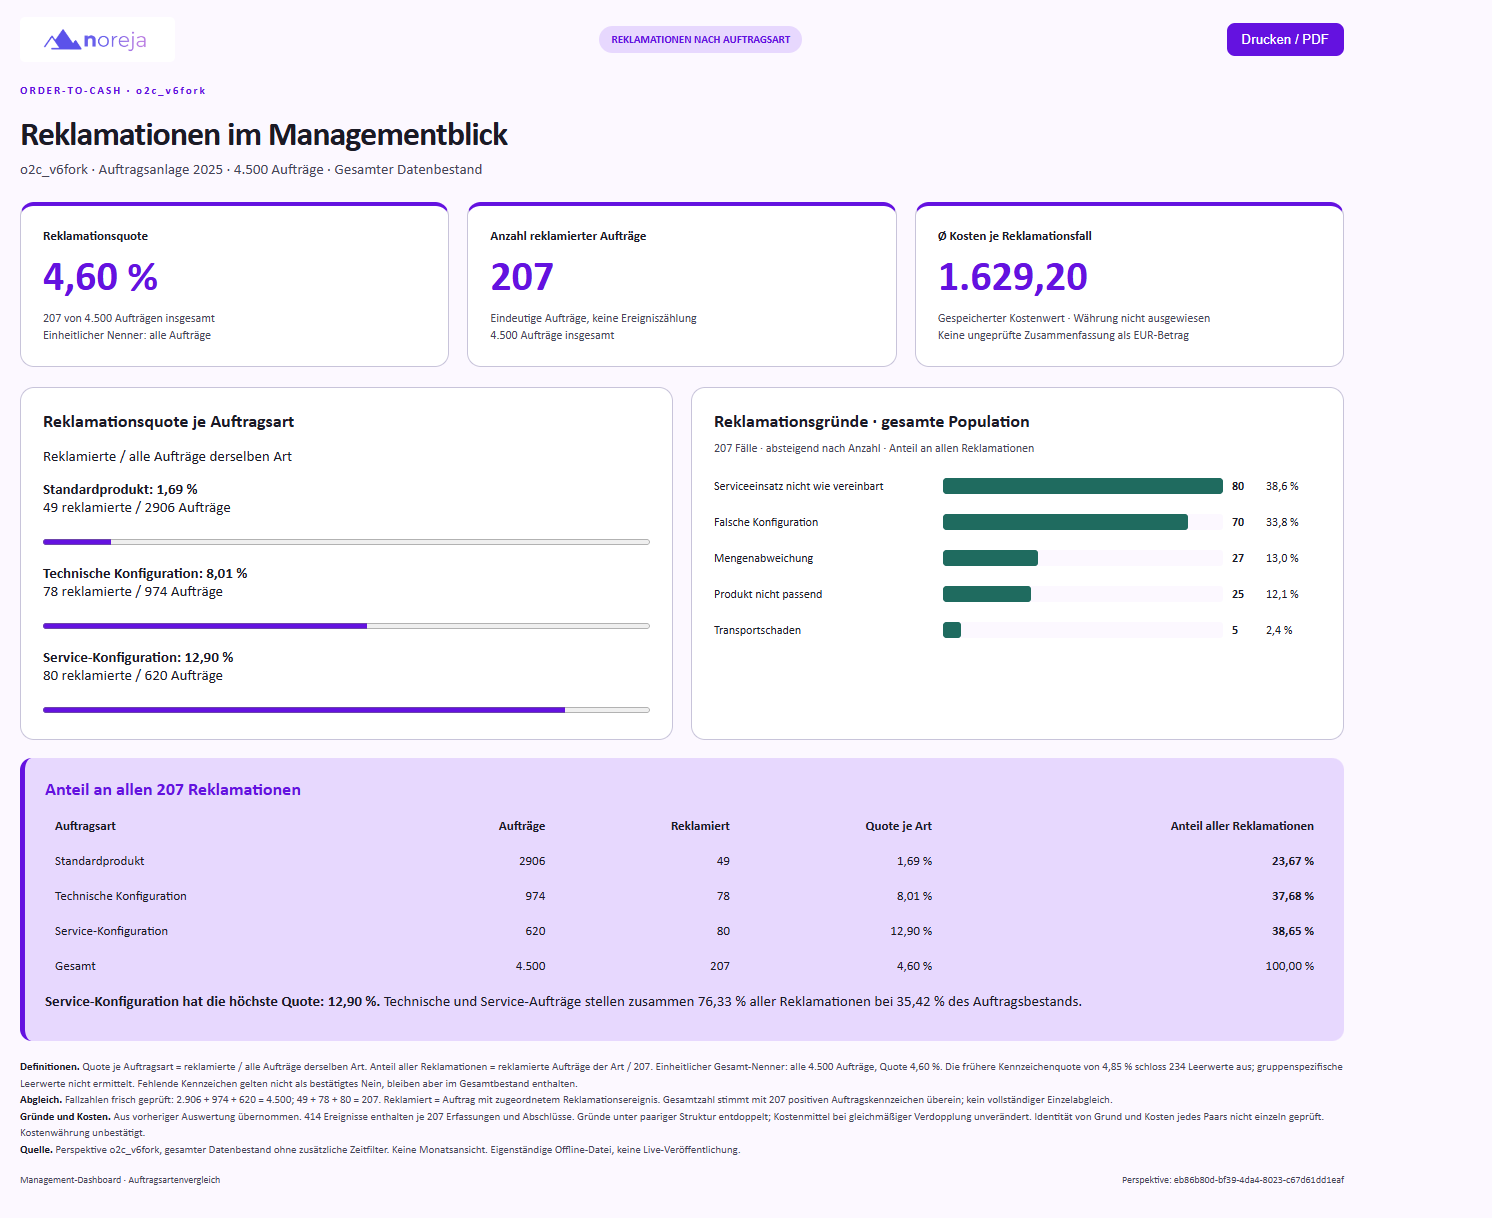
Complaints from a management view – rate by order type, complaint reasons.
Finding 3 · The target process includes a review. In reality, it is often skipped
For technical orders, the business process knowledge contains a clear dependency: If an order is changed before its release, an order review is required afterwards.
Simplified, the target logic is: Order change → Order review → Release.
In the perspective, 340 orders were changed before release – visible from the count under the activity “Change order”. Only 143 of them then go through the intended review path via “Review order”. 197 cases, or around 58%, go directly to release instead.
Noreja does not simply treat such deviations as additional process variants but as error patterns. This keeps the actual, business-relevant variants manageable, while deviations are analyzed separately and specifically.
In classic, event-log-based process mining approaches in particular, every deviation can quickly appear as its own variant. The number of variants grows sharply and the analysis becomes confusing. Noreja therefore deliberately separates business (causal) process variants from error patterns.
The logic behind it is simple: How does my process run? → Where does it deviate? → Why?
The causal perspective describes the expected flow. Error patterns show where this flow is violated – for example through skipping, wrong order, rework, delay, batching via shared resources or open cases.
The error pattern is not the cause itself but the starting point for root-cause analysis. In the O2C example, the first finding is: The intended review is frequently skipped. Next, we examine why this happens and whether this specific deviation is actually related to complaints.
This turns a visible deviation into a targeted root-cause analysis.
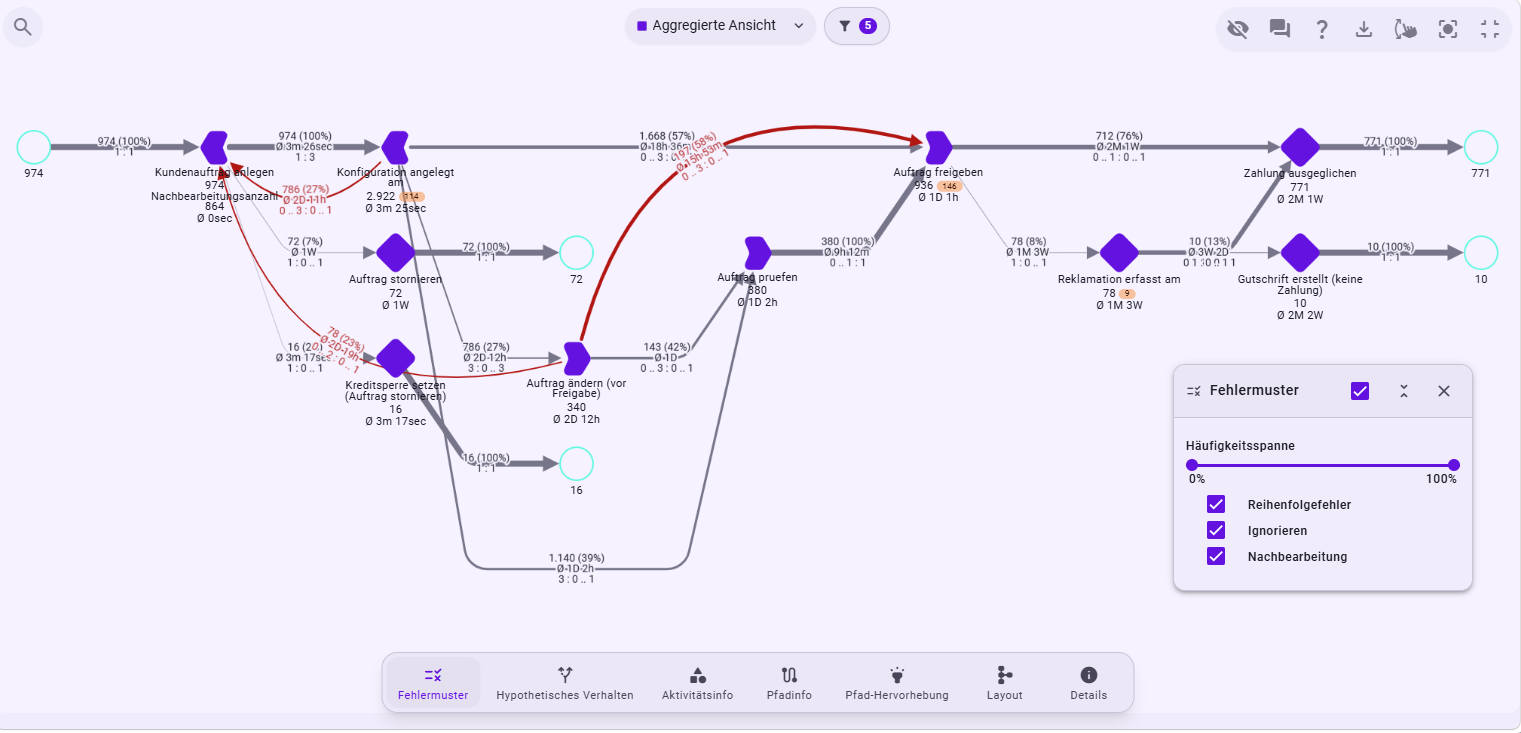
Technical O2C perspective with error patterns. After a change, the intended order review is skipped in a relevant share of cases.
A visible error pattern is a starting point for analysis – but not yet a root cause.
Finding 4 · The first plausible explanation is refined by the data
The broad root-cause analysis deliberately starts open-ended. Minerva uses a root-cause skill for this and structures documented complaint reasons, upstream factors and still-open hypotheses. In doing so, the analysis separates evidenced findings from assumed mechanisms.
Business question to Minerva
“Analyze all reasons that lead to a complaint.”
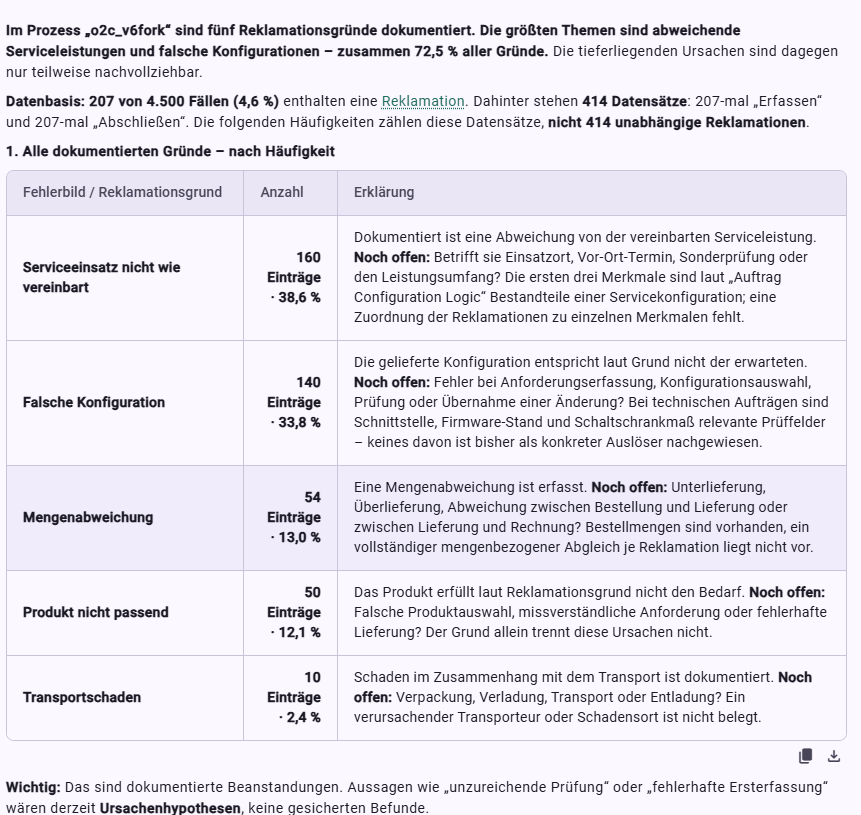
Noreja AI Minerva separates documented complaint reasons from still-open root-cause hypotheses
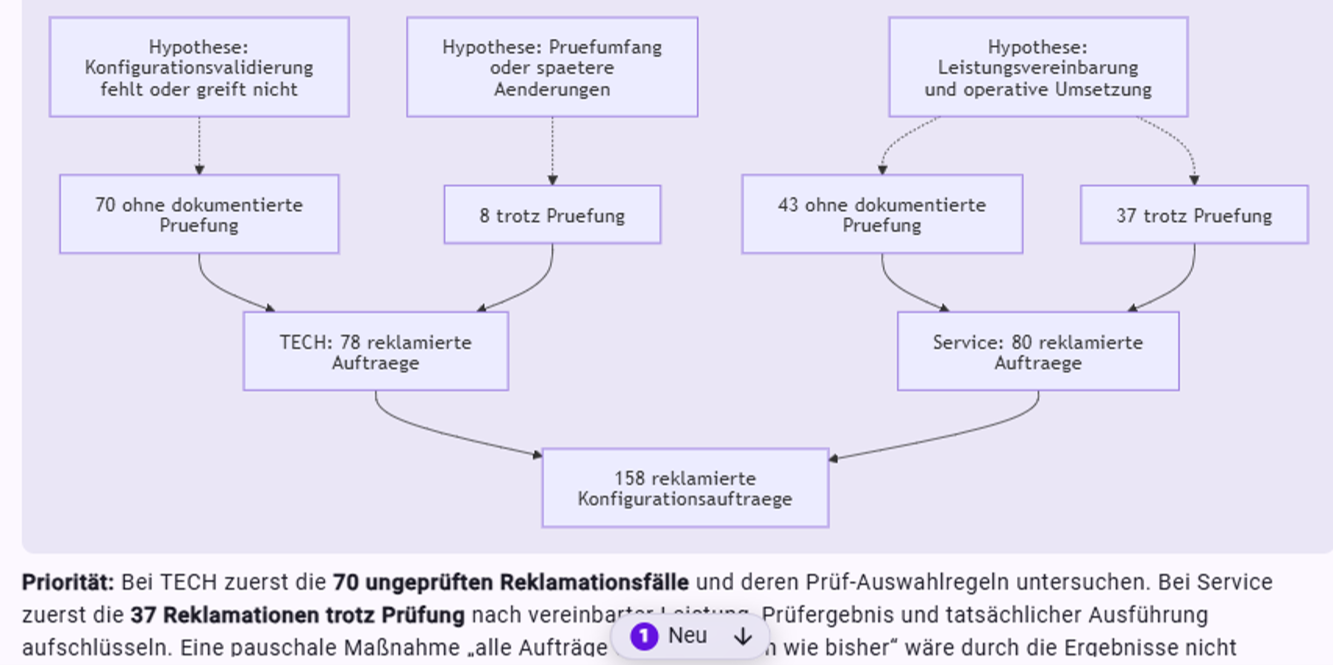
Prioritizing the next analysis – technical configurations without review stand out; for service, review does not sufficiently explain the quality difference
A first focus emerges for technical configuration orders: Of 78 technical orders with complaints, 70 have no documented order review. For service, the picture is far less clear, with 43 complaints without and 37 despite a review. The service track is therefore deliberately left open instead of inventing a cause.
Special configurations were already visible as a relevant starting point in the first analysis. That is why the next question is deliberately phrased more simply, without prescribing the desired grouping to Minerva:
Business question to Minerva
“Analyze the unreviewed technical orders in more detail. What influence do special values and changes before release have on the complaint rate? Are there individual special characteristics that stand out in particular?”
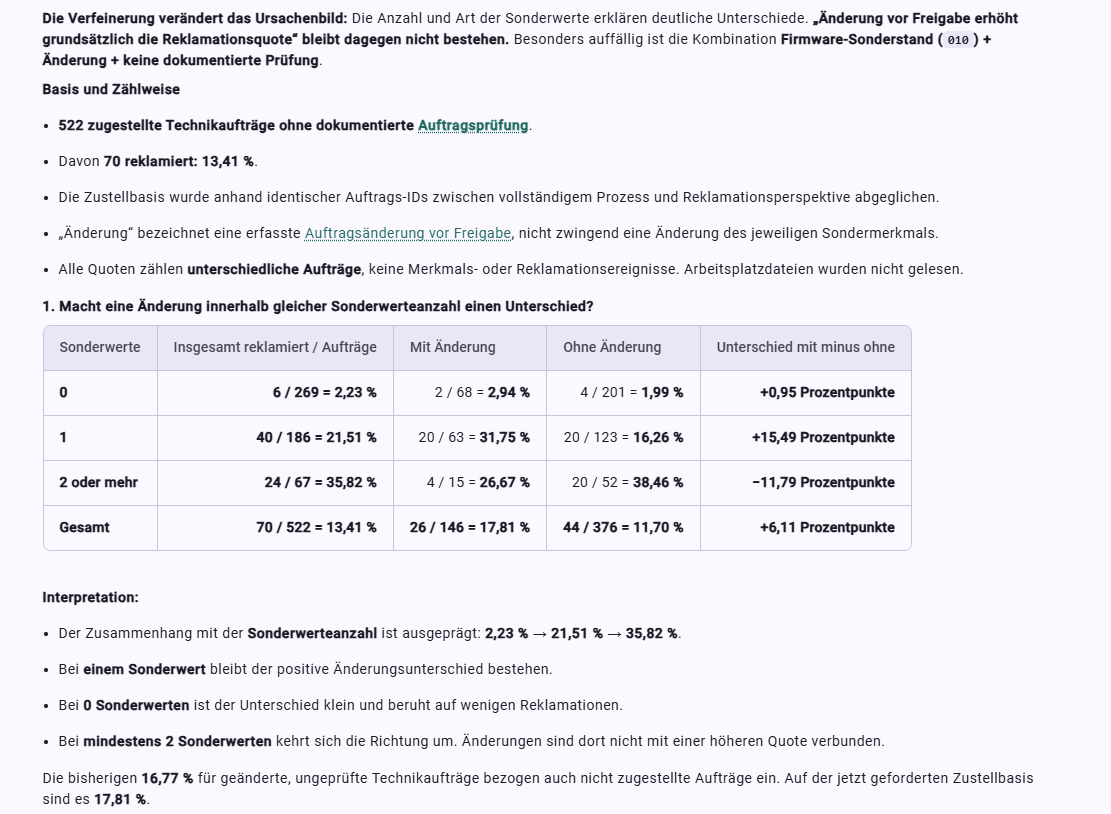
Refining the root-cause analysis – special values explain the risk much better than the blanket change hypothesis.
A further drill-down shows that individual special characteristics also differ in how much they stand out.
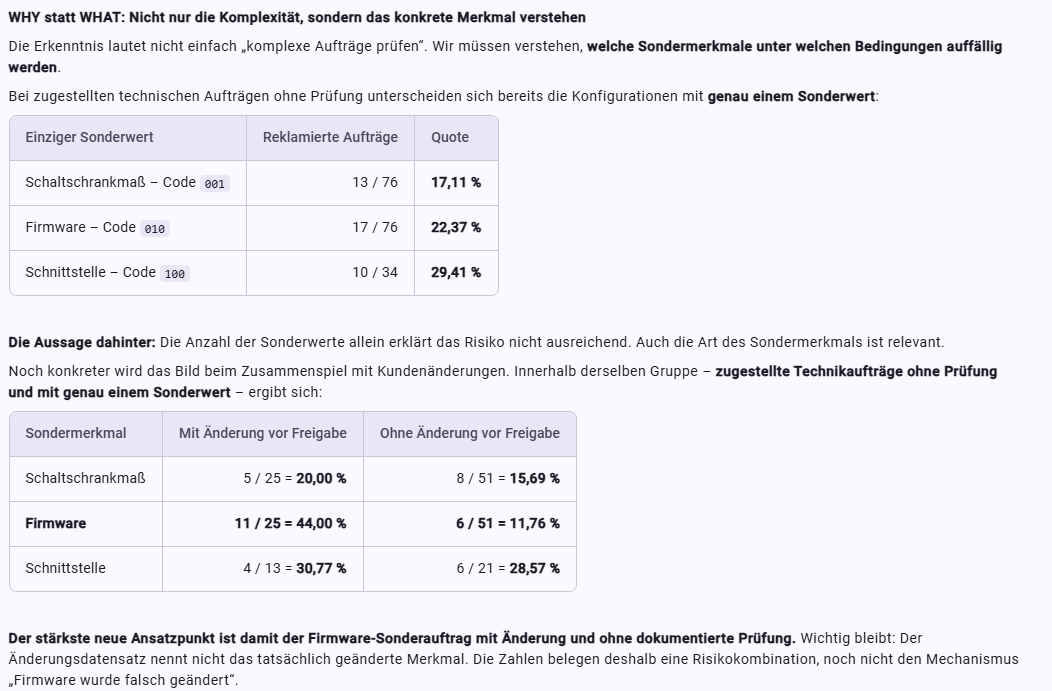
Drill-down on individual special characteristics for delivered technical orders without review.
The combination of special firmware version, change before release and missing review is particularly striking. However, the data does not show whether the firmware itself was actually changed during the change. The finding is therefore a targeted hypothesis for the next analysis – not a proven mechanism.
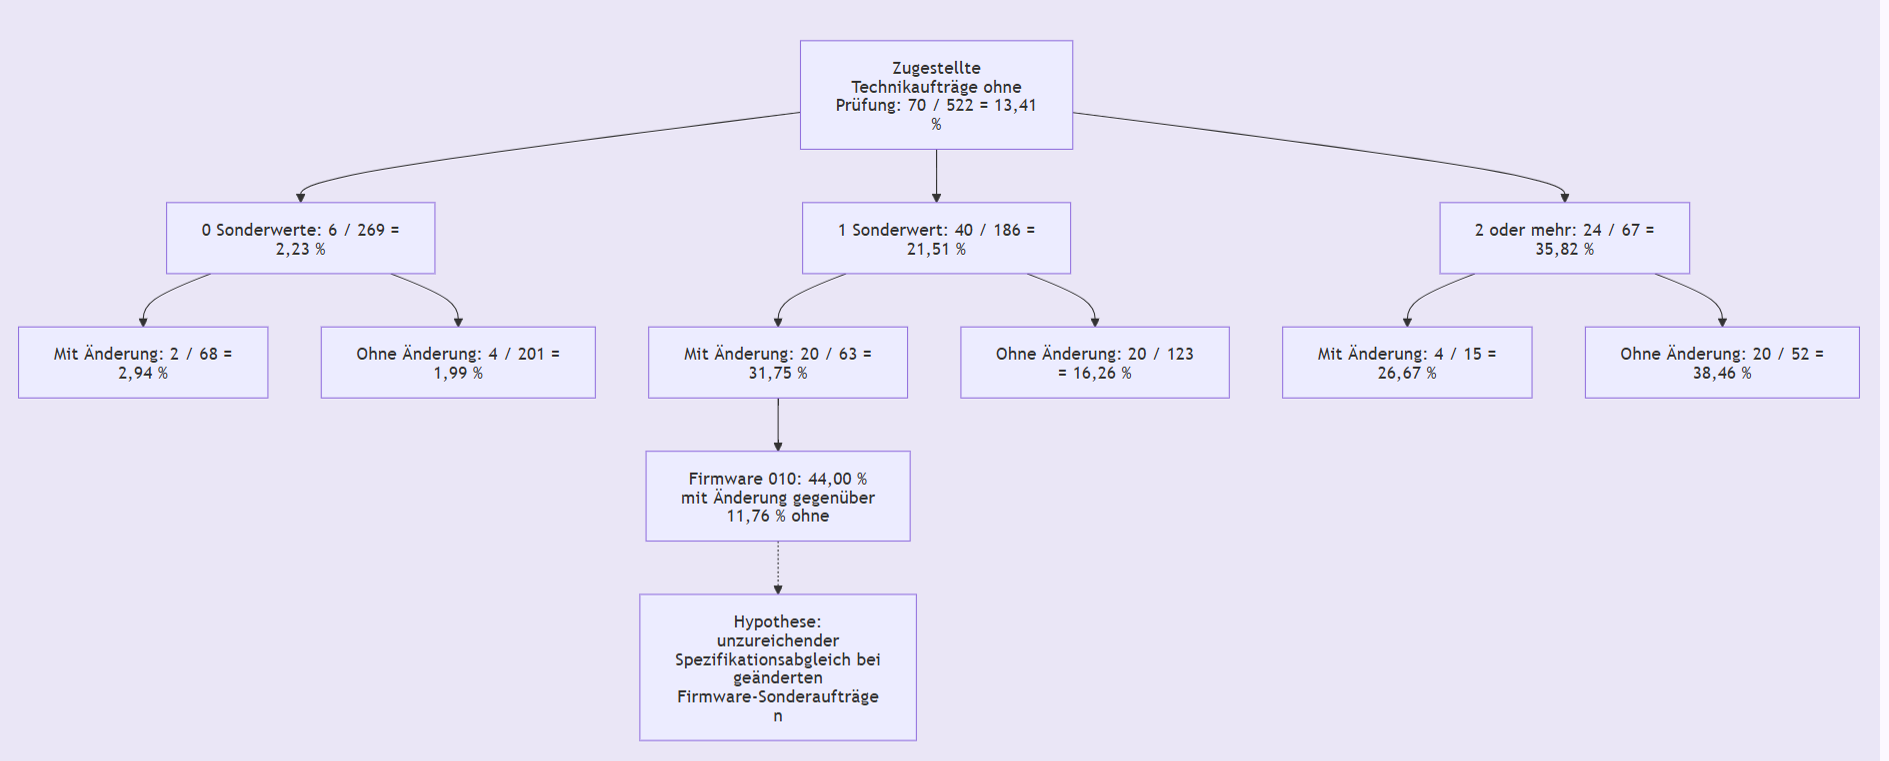
Refined root-cause picture / hypothesis tree on special values, change and missing review.
Process data alone does not provide meaning
The system data contains attributes such as order type, configuration and configuration characteristics. What these values mean from a business perspective is not automatically apparent from them. In the company context, it can therefore be stored how configuration characteristics are to be interpreted, which deviations from the standard are relevant from a business perspective and which rules apply in the process.
Process data provides the facts. Company context provides the meaning. Causal Process Mining tests the root-cause hypotheses.
Minerva connects these levels in dialogue. This turns a technical data attribute into an analysis question that can be interpreted from a business perspective, without delegating the decision to a language model.
Finding 5 · From the cause to a risk-based review rule
For the management decision, what ultimately counts is not only the explanation but the question of when a review actually makes sense. That is why delivered technical orders are compared by special values and documented review.
For orders without a special value, no quality advantage from an additional review can be seen in this data. From one special value onward, however, reviewed and unreviewed orders differ significantly.
The resulting measure
- Keep the existing requirement: If an order is changed before release, the intended review remains in place.
- Add a risk-based rule: Technical orders with at least one special value are additionally reviewed with priority, even if no change has taken place.
- Use the automation potential: Technical orders without a special value can more readily run without an additional review, provided there is no other reason for review.
Other manual interventions – such as clarifications, order changes or credit-related exceptions – do not automatically disappear as a result. The review rule addresses a specific lever within the touchless rate, not the overall degree of automation.
The economic view
In the synthetic dataset, the average stored cost of an order review is 90.25 and that of a complaint is 1,629.20. One complaint thus corresponds roughly to the effort of about 18 reviews. This makes a targeted review of genuinely risky orders economically plausible.
Why AI needs Causal Process Mining
Generative AI can summarize patterns, explain results and formulate measures very quickly. For process automation, however, speed alone is not enough. An AI working on a data view that is too coarse or wrong from a business perspective can just as quickly translate a plausible correlation into a wrong automation rule.
Automating a process based on the wrong analysis doesn't make it better – just wrong faster.
In the O2C example, the first plausible rule would have been: “Changed orders are reviewed too rarely, so let's review all changed orders more consistently.” The refinement shows, however, that the number and type of special values explain key differences and that the blanket change hypothesis does not hold.
For AI-supported process decisions, four things are therefore particularly important: the relevant business granularity, the relationships between business objects, company context for interpretation, and an analysis that does not prematurely treat observed relationships as causes. This is exactly where Causal Process Mining provides the analytical foundation. Minerva makes this foundation usable in dialogue and helps choose the next sensible analysis path.
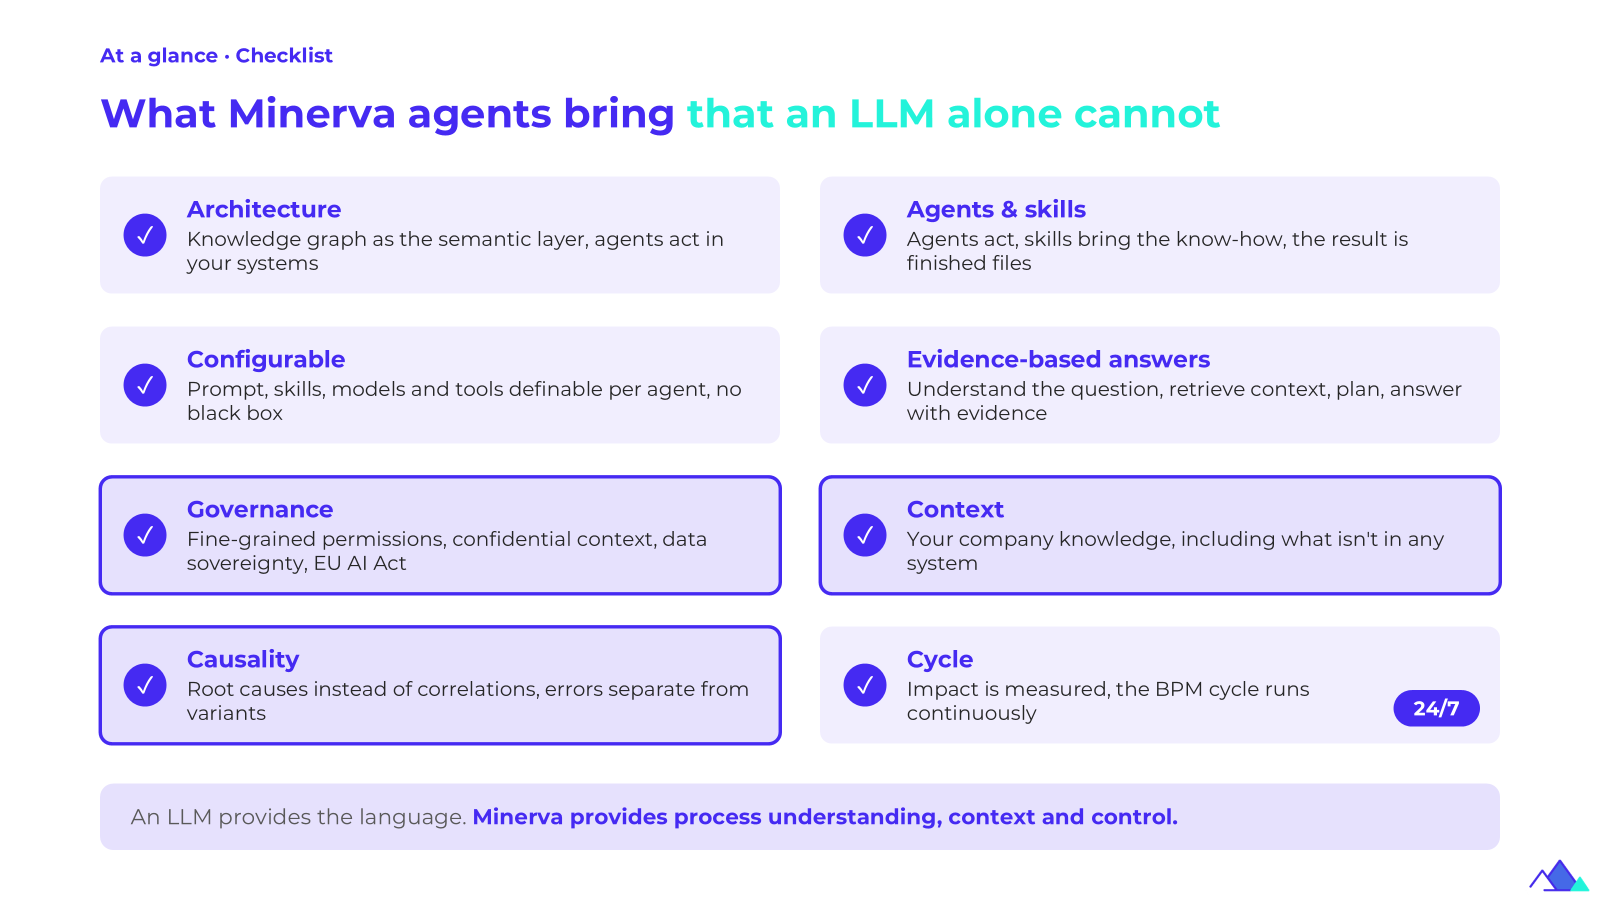
Checklist “What Minerva agents do that an LLM alone can't” – Minerva only sees what you see, and confidential data stays in-house.
Causal Process Mining creates the analytical foundation. Minerva makes it usable for the user in dialogue.
From finding to prioritized measure
A finding doesn't change a process yet. After the analysis, the process owner has to decide which insights should actually be acted on and which measure makes sense from a business perspective.
This is where the bridge to the Business Impact Board comes in: Findings are not just collected but assessed, for example, by expected impact, implementation effort, risk and uncertainty. Process Excellence and the business department can thus jointly prioritize which decision hypothesis is implemented as a pilot and which deliberately follows later.
Example areas for action
| Finding | Possible direction for improvement | Impact to be assessed |
|---|---|---|
| Order review is frequently skipped after changes | Enforce the existing review rule more consistently and investigate why it is skipped | Quality, compliance, complaint risk |
| Special configurations show significantly higher complaint rates | Prioritize technical orders with at least one special value for review on a risk basis | Complaint rate, quality, review effort |
| Orders without a special value show no recognizable quality advantage from additional review | Selectively reduce additional reviews for low-risk orders and test this as a pilot | Touchless rate, lead time, degree of automation |
| Special firmware version + change + missing review stands out in particular | Analyze this constellation further and, if appropriate, test a specific review rule | Quality, complaint risk, uncertainty of the hypothesis |
| Service complaints remain high despite review | Investigate causes outside the current review rule, such as the service agreement and actual execution | Service quality, complaint rate, customer satisfaction |
The cycle: Insight → Action → Impact → Feedback
The impact of a prioritized measure is then measured again using the same process data: This creates a closed improvement cycle:
| Step | O2C example |
|---|---|
| Insight | Special configurations show clearly different risk profiles; “change = risk” is not sufficient as an explanation. |
| Action | Keep existing mandatory reviews and prioritize technical special configurations on a risk basis. |
| Impact | Measure touchless rate, complaint rate, OTIF and costs again after introducing the pilot rule. |
| Feedback | If the expected impact is not confirmed, the hypothesis is adjusted. |
Check the impact after every measure
- Does the touchless rate actually increase for the targeted order groups?
- Does the complaint rate drop for technical special configurations?
- Are intended order reviews after changes carried out more reliably?
- Does the number of unnecessary reviews for low-risk orders decrease?
- Do OTIF, lead time and costs improve at the same time?
- Does the impact remain stable – or does the problem merely shift to another point in the process?
Minerva Frontier Agents can support this control loop 24/7: detecting new findings, developing hypotheses further and continuously monitoring the impact of implemented measures.
Conclusion: As much touchless as possible, as much effective review as necessary
The order-to-cash process shows why a high touchless rate alone is not sufficient steering logic. The real question is where a manual intervention adds no value and where it protects a risky order from a later quality problem.
Causal Process Mining therefore doesn't start with the largest possible process map and doesn't end with a red path. It combines business target logic, observed error patterns, company context and targeted comparison groups. In the O2C example shown, this corrects an initially plausible explanation: It is not the change alone that separates good and bad cases, but above all the risk profile of the special configuration.
“More touchless” thus becomes a more concrete measure: automate low-risk orders more, review technical special configurations in a targeted way, and then measure whether the rule actually improves quality and efficiency.
Understand. Prioritize. Automate effectively. Protect quality.
Five principles for the analysis
Preserve granularity
Order, item, configuration, change, review, delivery, invoice, payment and complaint are preserved as independent business objects with their relationships. The data is not reduced upfront to a single linear case logic.
Start with the question
For a specific business question, a suitable business (causal) perspective is created. In the O2C process, this makes it possible, for example, to analyze order receipt, delivery performance, receivables management or complaints separately, even though they are based on the same process knowledge.
Separate error patterns from causes
A skipped review is a relevant error pattern. Whether it explains the later complaint, however, has to be checked separately. Exactly this separation prevents visible deviations from being declared root causes prematurely.
Include context
System data shows values and events. Business context explains how configurations, special characteristics and process rules are to be interpreted in the company. This is especially important when Minerva or other AI functions work with the process data.
Frequently asked questions about order-to-cash
Why isn't a high touchless rate automatically good?
Because not every manual step is waste. Some reviews protect risky orders from later quality problems. What matters is therefore not the maximum touchless rate, but the right balance between automation and effective control.
What is a causal perspective?
A causal perspective maps the relevant business objects, events and expected business dependencies for a specific business question. This allows the same O2C process to be examined, for example, from the perspective of order receipt, delivery performance, receivables management or complaints.
Why is an error pattern not yet a root cause?
An error pattern initially shows where the observed flow deviates from the expected process logic – for example, when an intended review is skipped. Whether exactly this deviation causes a later business effect must then be checked with suitable comparison groups and further attributes.
What role do Minerva and company context play?
Process data provides values and events. Company context explains their business meaning and the rules that apply in the company. Minerva connects process knowledge, analysis skills and context in dialogue, structures hypotheses and prepares the basis for decisions. The business decision on measures remains with humans.