
Working with the Process View
Overview
The Process View is the heart of the application—a living process model that you can interrogate from multiple angles. Dominating the centre of the screen is the Main Canvas where the end‑to‑end process unfolds as nodes (activities) and connectors (paths). On the left, the Variant List ranks all observed behavioural patterns by frequency. Selecting a variant highlights its path on the canvas, while the circular reset icon instantly clears the spotlight when you wish to continue exploring. If the list grows long, pagination lets you scan through it without overwhelming the interface. The right‑hand Representation Panel is your toolbox for changing what the canvas emphasises, while a Process Details section directly beneath the graph surfaces key performance indicators—cycle times, rework rates, custom metrics—whenever you click an activity or path. Together these elements create an interactive cockpit that guides you from a bird’s‑eye view to granular evidence and back again within seconds.
Representation Options
The representation panel lets you tell the story that matters:
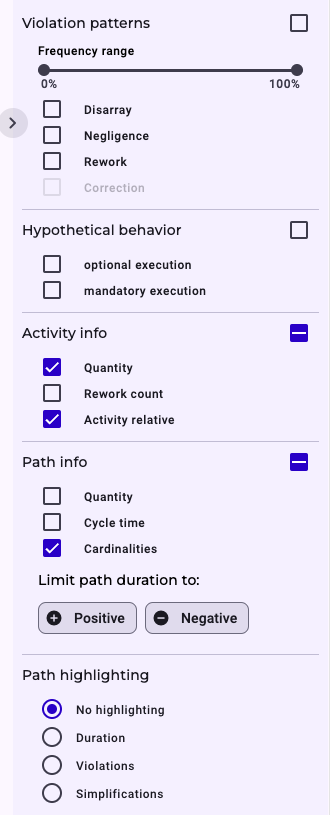
Violation Patterns exposes non‑conformant behaviour by fading in paths in a red colour. A single slider fine‑tunes how many of the most frequent violations remain visible, helping you focus on the most pressing issues first. You can choose between the following violation patterns: Disarray, Negligence, Rework, and Correction. Read more on the violation patterns here.
Hypothetical Behaviour flips the perspective from what did happen to what could have happened. You may reveal optional paths that were allowed by the model but never executed, or flag mandatory steps that the real world skipped. Read more on the hypothetical behaviour and its patterns here:
Activity Info lets you display more information on the activity elements. It helps to steer the analysis in the right direction by showing only the information necessary for what is important.
- Quantity: Shows value of Paths (abs.) + still running instances that did not reach an allowed end point
- Rework count: Shows the absolute number of recorded Rework of this particular activity
- Activity relative: Shows value of Start time (avg./rel.)
Path Info lets you display more information on the path elements.
- Quantity: Shows value of Paths (abs.)
- Cycle time: Shows value of Transition time (avg.)
- Cardinalities: Shows a combination out of the various cardinality indicators
Highlighting is an option to bring specific behaviour on the paths more directly into the focus of attention.
- No highlighting
- Duration: Creates a color scale using 5 different hues from green to yellow to red. In the legend below, the color tones are assigned specific transit times.
- Violations: Marks process paths in red where at least one violation has been recorded. This means that at least one transition time between the adjacent activities is in the negative range (read more on the difference between positive and negative times).
- Simplifications: Colors process paths green where at least one activity was skipped permissibly. This means that the process has taken a shortcut that was previously marked as a permitted skip during dimension modeling.
Export Options
When your exploration crystallises into a finding, you can share it immediately. The Download icon above the canvas offers two outward channels. A BPMN 2.0 export (XML) lets you continue modelling or automation work in any compliant BPM suite, while high‑resolution PNG or JPEG snapshots are perfect for slide decks, wikis, or audit reports. You decide whether to capture the full process or only the current viewport and may even change the background colour so the picture blends seamlessly into corporate templates. A small question mark icon next to the downloader keeps every symbol explained for newcomers. More on this in the next section. Read more on the export options here.
Details
By clicking on elements on canvas (activity or path) of the process view, you can get a large amount of fine-granular key performance indicators and additional properties: 1) Time-Related key performance indicators, 2) Behavioural-Related key performance indicators, and 3) User-Specific Properties that you select during the Entity Configuration in the Builder.
Details on activities
If you click on an activity, the following information is calculated.
Time-related indicators
| Name | Explanation |
|---|---|
| Start time (avg./abs.) | Average date of all start times of the clicked process activity. I.e. on average, the execution of these activities started at this time. |
| Start time (min./abs.) | Earliest date at which the clicked activity type was ever executed. I.e. it is the start time of the clicked activity type that has the oldest start date. |
| Start time (max./abs.) | Latest date at which the clicked activity type was ever executed. I.e. it is the start time of the clicked activity type that has the most recent start date. |
| Change time (avg./abs.) | Average time of all changes for process cases. This means that, on average, the change was made at this point at the specified time. |
| Change time (min./abs.) | Earliest change date on which the clicked activity type was ever executed. In other words, this is the time of the clicked activity type that has the oldest change date. |
| Change time (max./abs.) | Latest change to the clicked activity type that has ever been made. In other words, this is the change time of the clicked activity type with the most recent change date. |
| Start time (avg./rel.) | Time interval between the average start time of the cases and the average start of the clicked activity type. I.e. on average, it took as long per process as indicated until the clicked activity type is reached. |
| Start time (min./rel.) | Minimum time interval between the start time of the cases and the start of the clicked activity type. I.e. in the shortest case, it took as long as indicated until the clicked activity type is reached. |
| Start time (max./rel.) | Maximum time interval between the start time of the cases and the start of the clicked activity type. I.e. in the longest case, it took as long as indicated until the clicked activity type is reached. |
| Change time (avg./rel.) | Time interval between the average start time of the process cases and the change time of the clicked activity type. This means that on average it took as long as indicated per process until the change to the clicked process activity was made. |
| Change time (min./rel.) | Minimum time interval between the change time of the process cases and the start of the clicked activity type. This means that in the shortest case it takes as long as specified until a change is made to the activity type clicked on. |
| Change time (max./rel.) | Maximum time interval between the change time of the process cases and the start of the clicked activity type. This means that in the longest case it takes as long as specified until a change is made to the activity type clicked on. |
Behavioural-related indicators
| Name | Explanation |
|---|---|
| Type | Name of the activity type. |
| Paths (abs.) | Absolute number of relations (or business objects) that exist between the adjacent activity types or start/end events. I.e. the process (or the business objects contained in it) has run over this path as often as indicated. |
| Batching included? | Indicates that business objects from originally separate cases merge or diverge for the clicked activity type. This means, for example, that two customer orders that were placed independently from each other will run into a single invoice. |
| Technical ID | Technical ID of the activity type. |
Details on paths
If you click on a path, the following information is calculated.
Time-related indicators
| Name | Explanation |
|---|---|
| Transition time (avg.) | Average duration between the two adjacent activity types based on all cases. |
| Transition time (min.) | Shortest duration of a case between the two adjacent activity types. |
| Transition time (max.) | Longest duration of a case between the two adjacent activity types. |
Behavioural-related indicators
| Name | Explanation |
|---|---|
| Paths (abs.) | Absolute number of relations (or business objects) that exist between the adjacent activity types or start/end events. I.e. the process (or the business objects contained in it) has run over this path as often as indicated. |
| Inbound cardinality (min.) | Is to be read in combination with the remaining three cardinality specifications. The minimum incoming cardinality describes the minimum number of business objects that have flowed out of the previous activity (or start/end event). I.e. if it says e.g. 3, it means that there are no business cases where less than 3 business objects resulted from the previous activity type. |
| Inbound cardinality (max.) | Is to be read in combination with the remaining three cardinality specifications. The maximum incoming cardinality describes the maximum number of business objects that have flowed out of the previous activity (or start/end event). I.e. if it says e.g. 24, it means that there are no cases where more than 24 business objects resulted from the previous activity type. |
| Outbound cardinality (min.) | Is to be read in combination with the remaining three cardinality specifications. The minimum outgoing cardinality describes the minimum number of business objects that flowed into the subsequent activity (or start/end event). I.e. if there is e.g. 8 here, it means that there are no cases where less than 8 business objects have flowed into the subsequent activity type. |
| Outbound cardinality (max.) | Is to be read in combination with the remaining three cardinality specifications. The maximum outgoing cardinality describes the maximum number of business objects that flowed into the subsequent activity (or start/end event). I.e. if there is e.g. 123 here, it means that there are no cases where more than 123 business objects have flowed into the subsequent activity type. |
| Process violation present | Indication of whether violations occurred at the selected point in the process that violate the predefined standard in the process template. The clicked process path appears red in the process model at this point. I.e. if activity A was originally supposed to take place before activity B, but in reality only takes place afterward, there is a process violation. |
| Associated with process pattern “Negligence” | The clicked path is directly or indirectly linked to a process pattern of the “Negligence” type. This means that certain activities were inadvertently skipped. |
| Associated with process pattern “Simplification” | The clicked path is directly or indirectly linked to a process pattern of the “Simplification” type. This means that certain activities have been permissibly skipped. |