
Deep Dive: Average Time Calculation
We distinguish between two levels of duration analysis:
Case Instance Level – where each individual process instance is analyzed.
Model Level – where information is aggregated across multiple instances, e.g., in a process model, variant model, or case model.
1. Case Instance Level
At this level, we calculate:
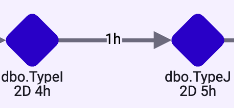
Activity Timestamp
Each activity within an instance receives a start timestamp, representing the moment the activity begins.
Transition Duration (Relationship)
For each relationship between two activities (e.g., "A leads to B"), we calculate the difference between their start timestamps:Transition Duration = Source Activity Start Timestamp → Target Activity Start Timestamp
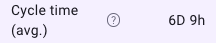
Case Instance Cycle Time
The total runtime of a case instance is calculated as the time span between the earliest and latest start or change timestamp within that instance:Cycle Time = MIN(Start/Change) → MAX(Start/Change)
2. Model Level (Process / Variant / Case Model)
At the model level, we aggregate data from multiple instances and derive the following metrics:
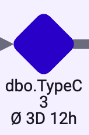
Activities
For each activity, we aggregate the start timestamps across all included instances and display:MIN / MAX / AVG of all start timestamps per activity
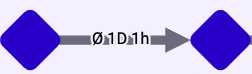
Relationships (Transition Durations)
Similar to the instance level, but aggregated across all cases:MIN / MAX / AVG of all transition durations between activities
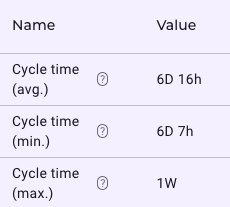
Model-Level Cycle Time
We also aggregate the individual cycle times of all case instances:MIN / MAX / AVG of all case instance cycle times
This logic enables precise analysis of individual process flows while also revealing broader patterns and outliers at an aggregated level. By clearly separating both views, we ensure full transparency throughout the analysis.