Average Time Calculation
Noreja shows many times: cycle times of cases, transition durations between activities, times since the start of a case. This page explains how each of them is measured and how the averages, minimums and maximums are calculated on the different levels, with figures from Purchase-to-Pay. For the levels themselves, see Process Models and Levels: Case, Variant, Process Model.
The Time Stamps behind Every Figure
Every activity of a case has a start time stamp and can have a change time stamp, for example when an order was changed later. All times are calculated from these two. There is no separate duration of a single activity.
Time stamps are read with the time zone they contain. If they contain none, Noreja uses the time zone chosen for the time stamp column in the entity Builder (Prepare timestamps → Time zone), otherwise a default of your installation (usually UTC). So times between activities don't depend on time zones. Dates in the details table are shown in your browser's time zone. See Timestamps: Formats, Preview and Distribution.
Times of a Single Case
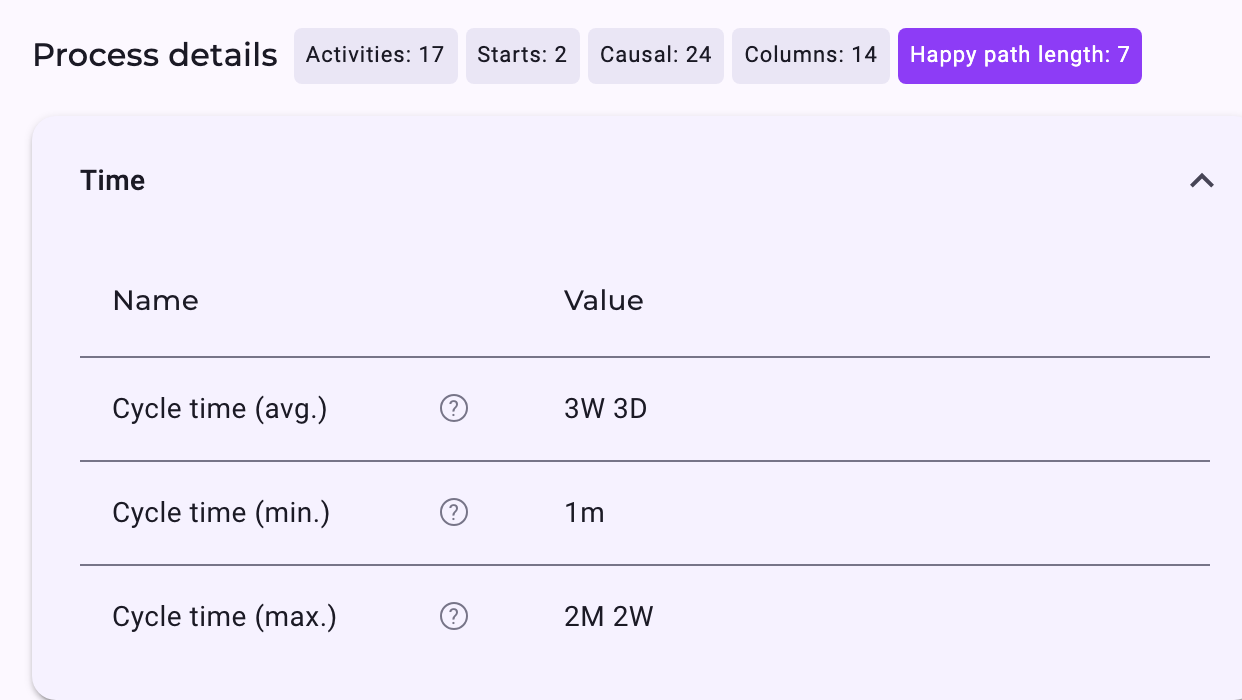
- Cycle time: from the earliest to the latest time stamp of the case, start or change. In Purchase-to-Pay, the shortest case took 1 minute, the longest 2 months and 2 weeks.
- Transition duration: for each relationship from one activity to the next, from the start of the first to the start of the second activity. It is negative if the second started earlier; see Positive and Negative Times. If one of the two has no start time stamp, the relationship has no transition duration. The details table calls it Transition time.
- Start time (rel.) and the change times marked "rel.": the time from the start of the case to the start or change of an activity.
Averages over Cases and over Executions
On the variant and process model, Noreja combines these times, and it matters what is counted:
Figure | Average over | Purchase-to-Pay |
|---|---|---|
Cycle time (avg.), Average process duration | Cases: each case counts once with its cycle time. | 3W 3D over 5,520 cases |
Transition time (avg.), the transition duration on a relationship | Executions: every time a case took this relationship counts, also several times in the same case. | "wareneingang eingegangen" → "wareneingang_pruefung geplant": Ø 2D 2h over 5,670 executions |
Start time (avg./rel.), the time on an activity | Executions of the activity. | "rechnung erfassung": Ø 1W 5D after the start of the case |
So a relationship that occurs three times in one order counts three times in the average of the relationship, while that order counts once in the average cycle time.
The minimum and maximum work the same way: the shortest and longest case, or the shortest and longest single execution of a relationship.
In the Case Model
The case model shows one case with each activity once. If an activity or relationship occurred several times in this case, its times are combined in the same way: average, minimum and maximum of these executions. See Process Models and Levels: Case, Variant, Process Model.
Things That Affect Averages
- Negative times are included by default and lower the average transition duration of a relationship. Use Limit path duration to: Positive to leave them out on the graph. The details table always includes them.
- Batching: an execution done for several cases at once counts once in the quantity of the process model. In the averages of the stored process model it counts once per case. A filtered view calculates these averages differently, so for batched activities the stored and the filtered averages can differ.
- Filters: averages always refer to the cases that match the filters of the tab; see From Events to Process Model: What Is Aggregated Where.
- Rounding: averages are rounded to whole seconds. Values from the import and values recalculated for a filter can therefore differ by up to one second.
On Dashboards
- Average process duration: the average cycle time of the cases, with the standard deviation in brackets. Purchase-to-Pay: 3W 3D (1W 6D).
- Average activity duration: the average transition duration between two activities you choose, from the start of the first to the start of the second, over all direct relationships between them, with its standard deviation.
See KPIs Explained and Dashboard Widgets.